


Figure 2.
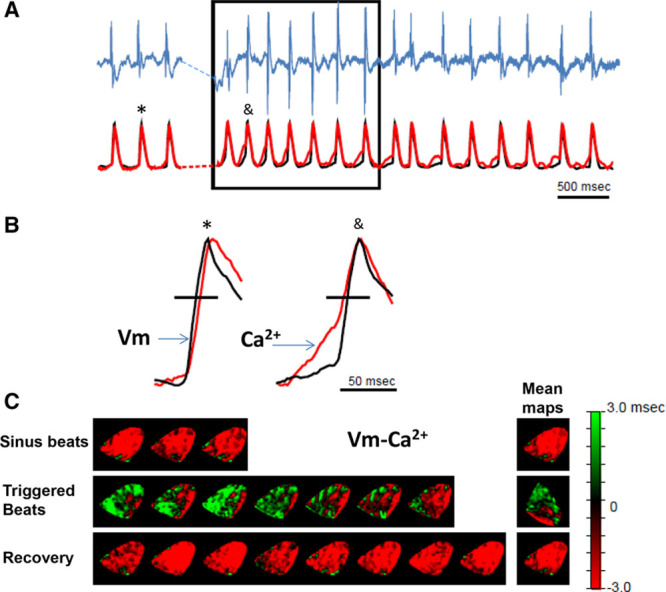
Spontaneous Ca2+ release precedes voltage depolarization during triggered activity in the subendocardium of the catecholaminergic polymorphic ventricular tachycardia heart. The heart was perfused with 3.6 mmol/L Ca2+ and 160 nmol/L isoproterenol. A, Volume-conducted ECG (top, blue) and optical signals obtained from a single pixel (black, voltage; red, Ca2+) at the earliest breakthrough on a subendocardial Purkinje fiber location. B, Enlarged representative traces for sinus (left) and triggered (right) beats. Symbols on top identify the specific beats selected from A. C, Beat-to-beat (left) and mean (right) Vm-Ca2+ timing difference maps for sinus (top), triggered (middle), and recovery (bottom) beats measured at 60% maximum depolarization (horizontal black lines in B).