
Fig. 2.
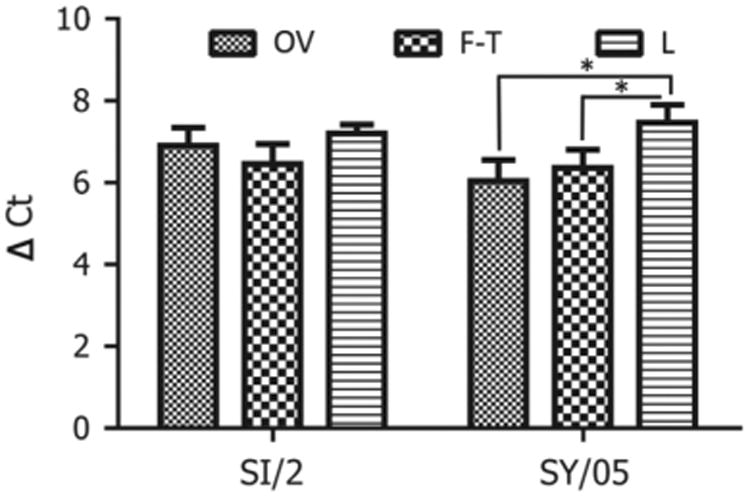
Optimization of the methods in detecting NP proteins using proximity ligation assays. OV denotes the control the control viruses, which were harvested directly after viral propagation in MDCK cells; F–T denotes the viruses, which were frozen and thawed 5 times; L denotes the viruses, which were treated with lysis buffer.