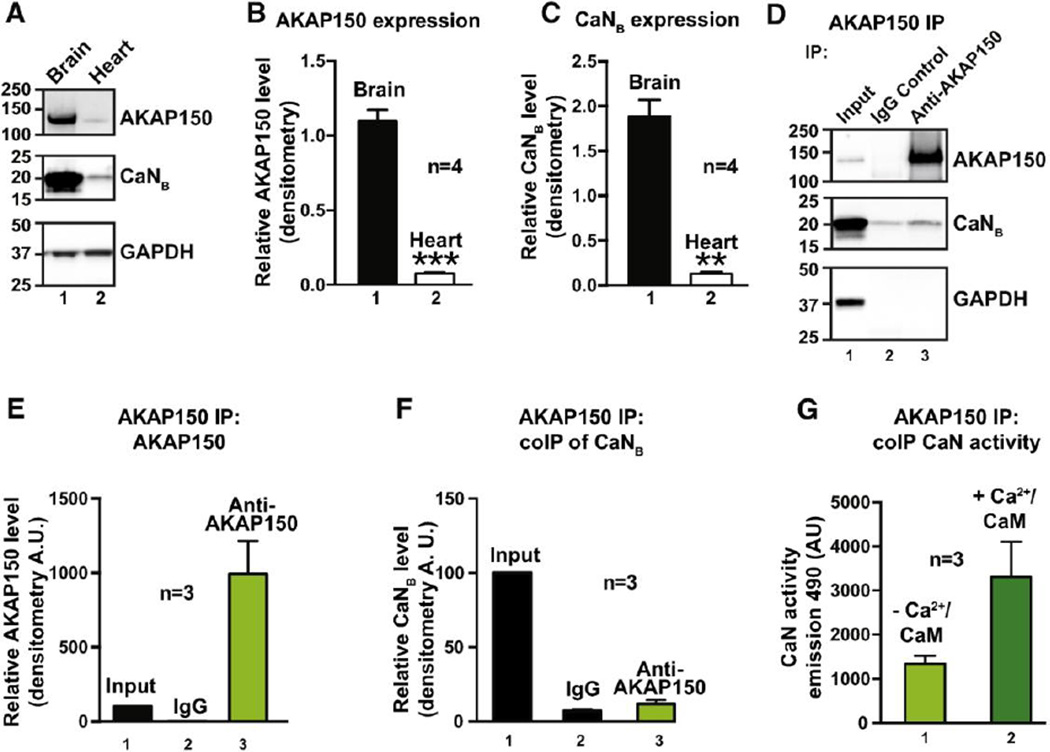
Figure 1. AKAP150 anchors low levels of calcineurin in the heart.
A–C, Evaluation of expression levels of AKAP150 (A top panel and B) and calcineurin (A mid panel and C). D, Immunoprecipitation of AKAP150 followed by immunoblot detection of AKAP150 (top panel) and CaNB (mid panel) in heart lysates from wildtype animals. E–F, Densitometry analysis of AKAP150 (E) and CaNB (F) enrichment. G, Bar plot of phosphatase activity in AKAP150 enriched fractions.

