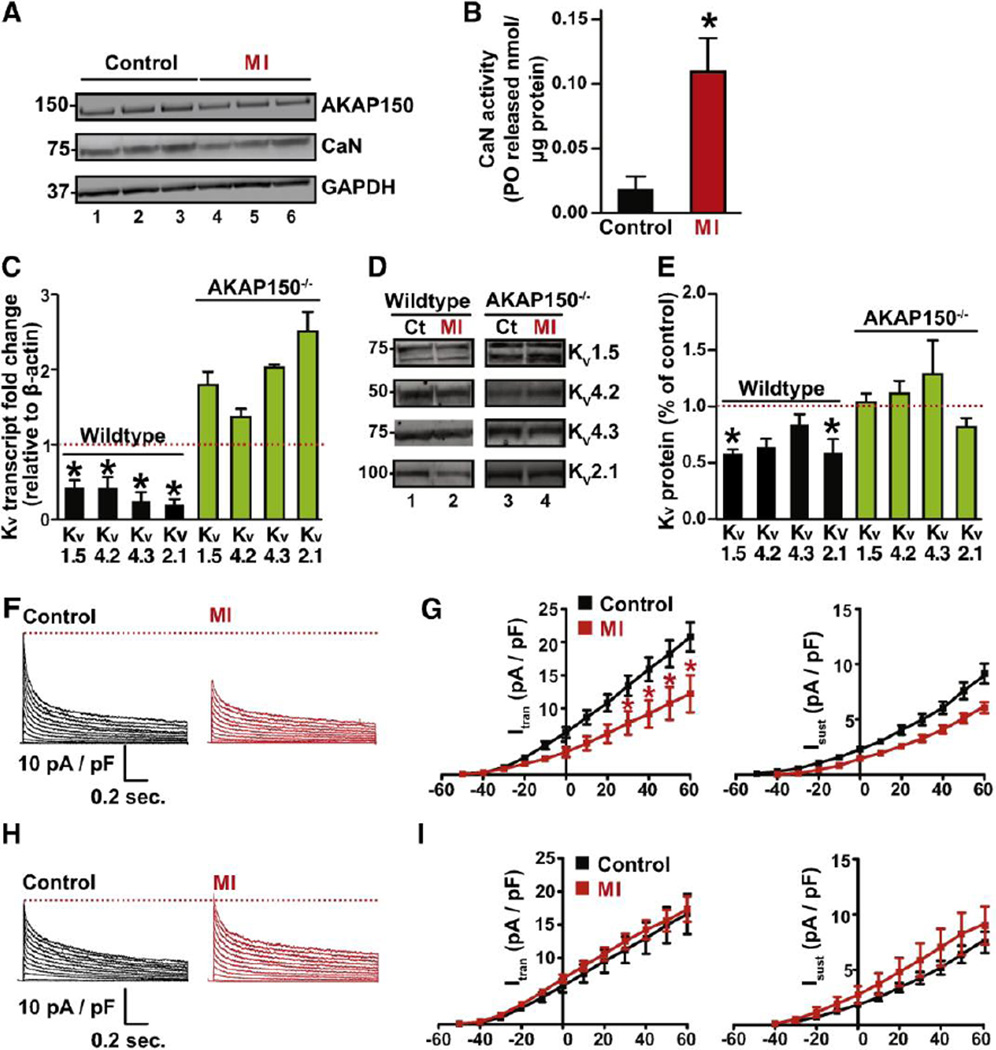
Figure 4. Ablation of AKAP150 prevents KV remodeling in adult cardiomyocytes after MI.
A, Western Blot analysis of AKAP150 and PP2B protein expression in WT (n = 3) control and MI (n = 3) hearts. B, Bar plot of cellular PP2B activity (PO released / µg protein) in WT control (n = 3) and MI hearts (n = 3). C, Summary data for transcript levels of KV1.5, KV4.2, KV4.3 and KV2.1 subunits in WT and AKAP150−/− control (n = 3) and MI (n =3) hearts. D, Representative blots of immunoreactive bands for KV1.5, KV4.2, KV4.3 and KV2.1 subunits in control (n = 3) and MI (n =3) hearts from WT and AKAP150−/− mice and (E) corresponding densitometry data. Representative whole-cell KV currents and current-voltage relationship of Itrans and Isust in WT (F and G) and AKAP150−/− (H and I) control and MI cells (WT: n = 10 and 8 cells for control and MI respectively) from 3 hearts; AKAP150−/−: n = 8 cells for both control and MI group, from 3 hearts). *P < 0.05.

