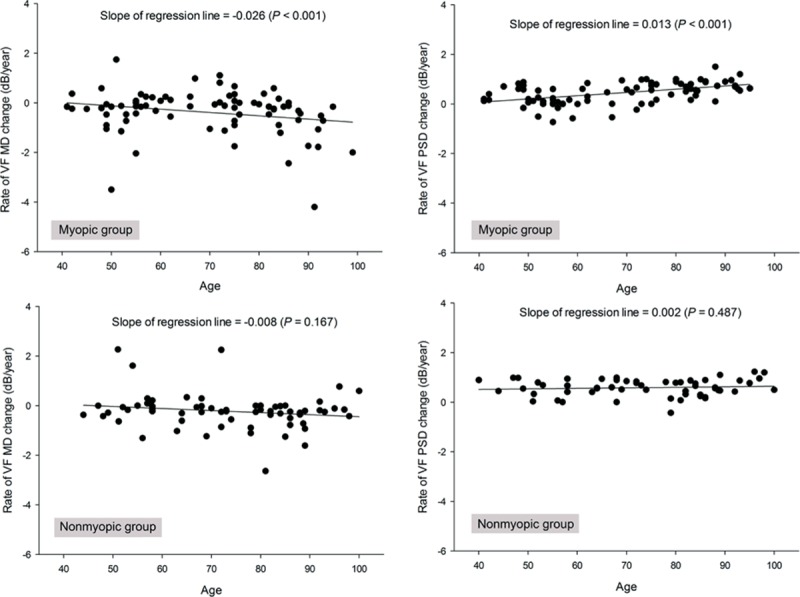
FIGURE 2.

Scatter plot showing the relationships between the rate of visual field parameters (mean deviation [MD] and pattern standard deviation [PSD]) and age in myopic and nonmyopic groups classified by axial length of 24.0 mm. MD = mean deviation, PSD = pattern standard deviation.
