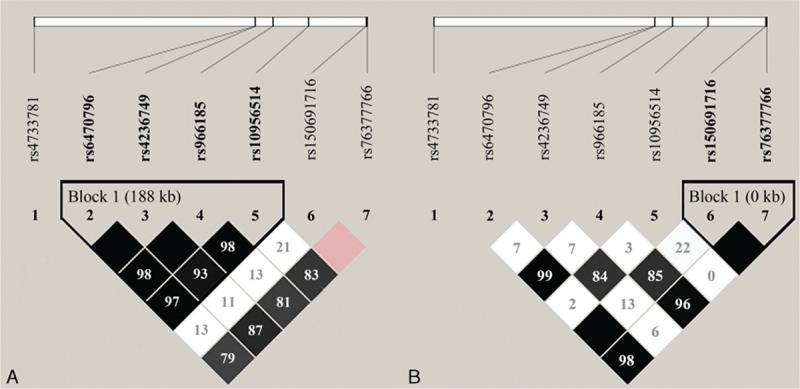
FIGURE 1.

Linkage disequilibrium patterns for the cluster of 7 SNPs in the ASAP1 gene genotyped in Western Chinese Han (A) and Tibetan population (B). Pairwise r2 values for all pairs of SNPs are presented as percentages in diamonds, and shading from white to black indicates the intensity of r2 from 0 to 1. Strong linkage disequilibrium is represented by a high percentage (>80%) and darker square. The darkest squares without a number mean 100%. SNP = single nucleotide polymorphism.
