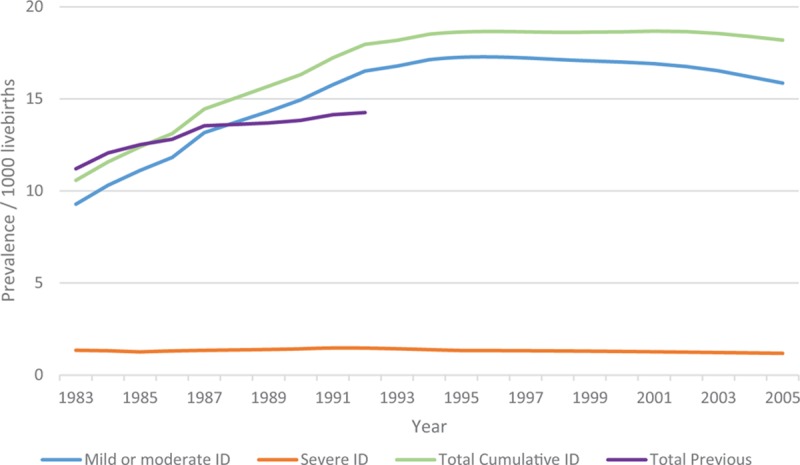
FIGURE 2.

Cumulative prevalence for births 1983 to 2005 with follow-up to 2010 by severity of intellectual disability (ID). Note: Unknown level of ID is included with mild or moderate ID. Total previous prevalence is for births 1983 to 1992 with follow-up to 1999.
