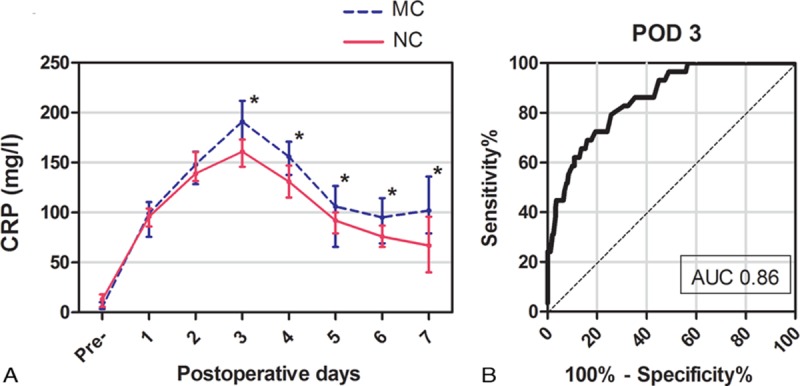
FIGURE 1.

A, Serial changes in CRP concentrations (median with interquartile range) for major complications (MC) and no complications (NC). ∗P <0.05. B, Receiver-operating characteristic curve (ROC) for postoperative day 3 (POD3) CRP concentrations showing an AUC of 0.86 (95% CI, 0.79–0.92).
