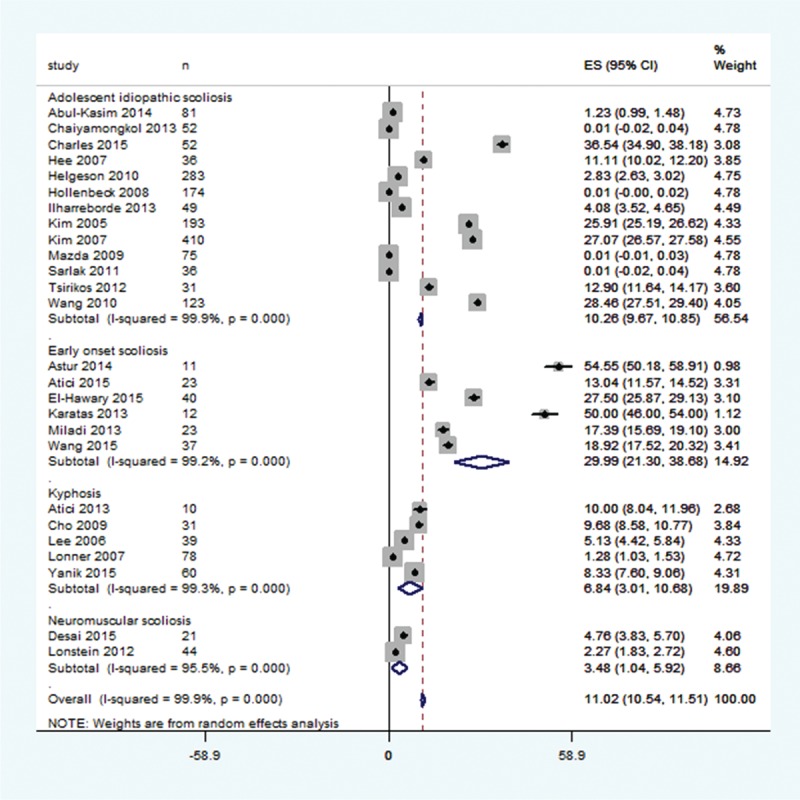
FIGURE 2.

A forest graph showing the results of a pooled analysis of the percent prevalence of proximal junctional kyphosis in the included studies and overall effect size according to conditions.

A forest graph showing the results of a pooled analysis of the percent prevalence of proximal junctional kyphosis in the included studies and overall effect size according to conditions.