
FIGURE 2.
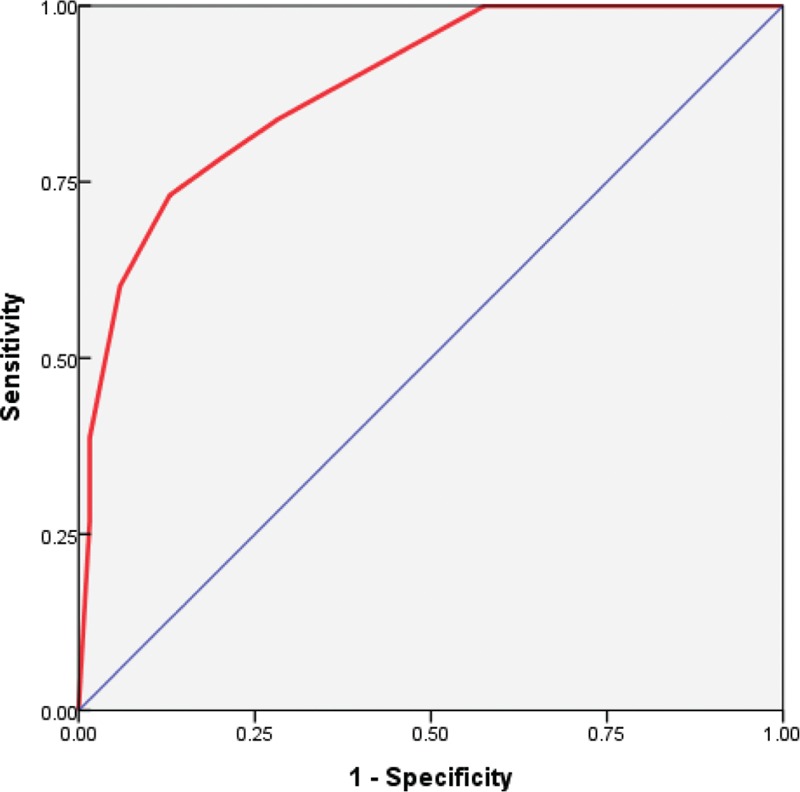
It shows the receiver operating curve (ROC) that corresponds to the multiple logistic model we applied to our data set of 367 patients. The area under the ROC is 0.885 (P < 0.001; 95% confidence interval, 0.847–0.922), which indicates the promising predictive power of the multivariate logistic-regression model. ROC = receiver operating curve.