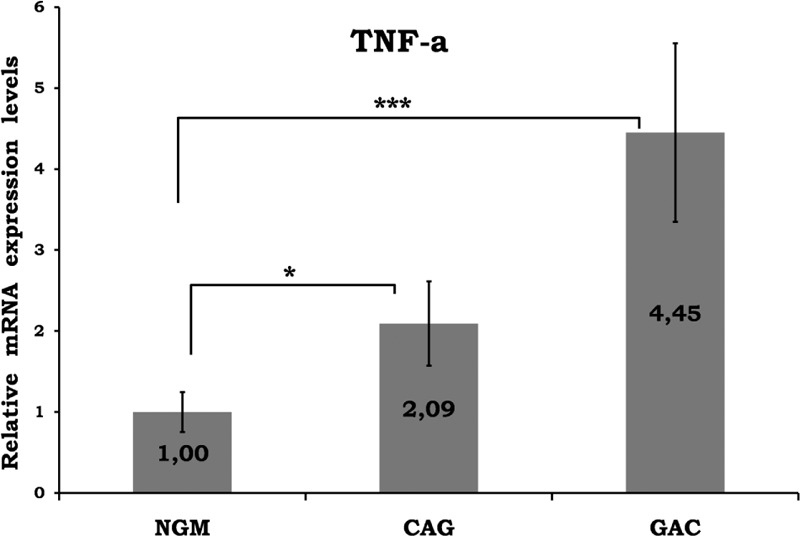
FIGURE 2.

Relative gene expression levels of TNF-α. The results were expressed as mean ± SEM. ∗P < 0.05 and ∗∗P < 0.001, respectively. CAG = chronic active gastritis, GAC = gastric adenocancer, NGM = normal gastric mucosa, TNF-α = tumor necrosis factor alpha.
