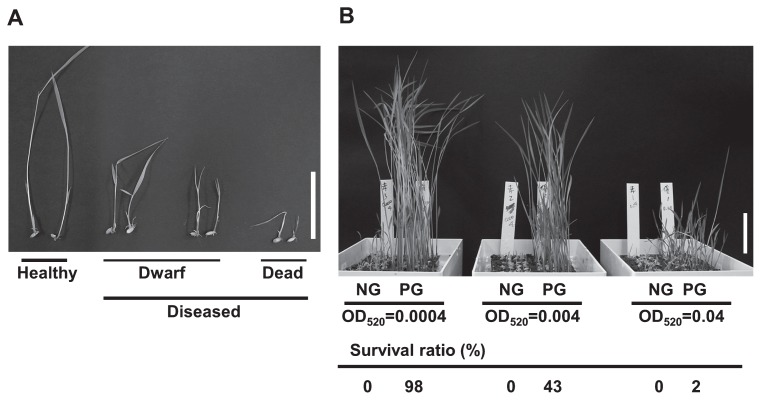
Fig. 4.
Preliminary experiments to determine the optimal concentration of bacterial pathogen, Burkholderia glumae, for inoculation. (A) The classification of disease symptoms at 7 days after inoculation. Healthy, normal phenotype; Diseased, dwarf or dead phenotype. Bar = 50 mm. (B) Results of the preliminary experiment. Photograph shows plants at 7 days after inoculation (n = 50–60). Non-germinated seeds (NG) and pre-germinated seeds (PG) were used for inoculation. Bar = 50 mm. Survival ratio (%) = (number of healthy plants/number of total seeds) × 100

