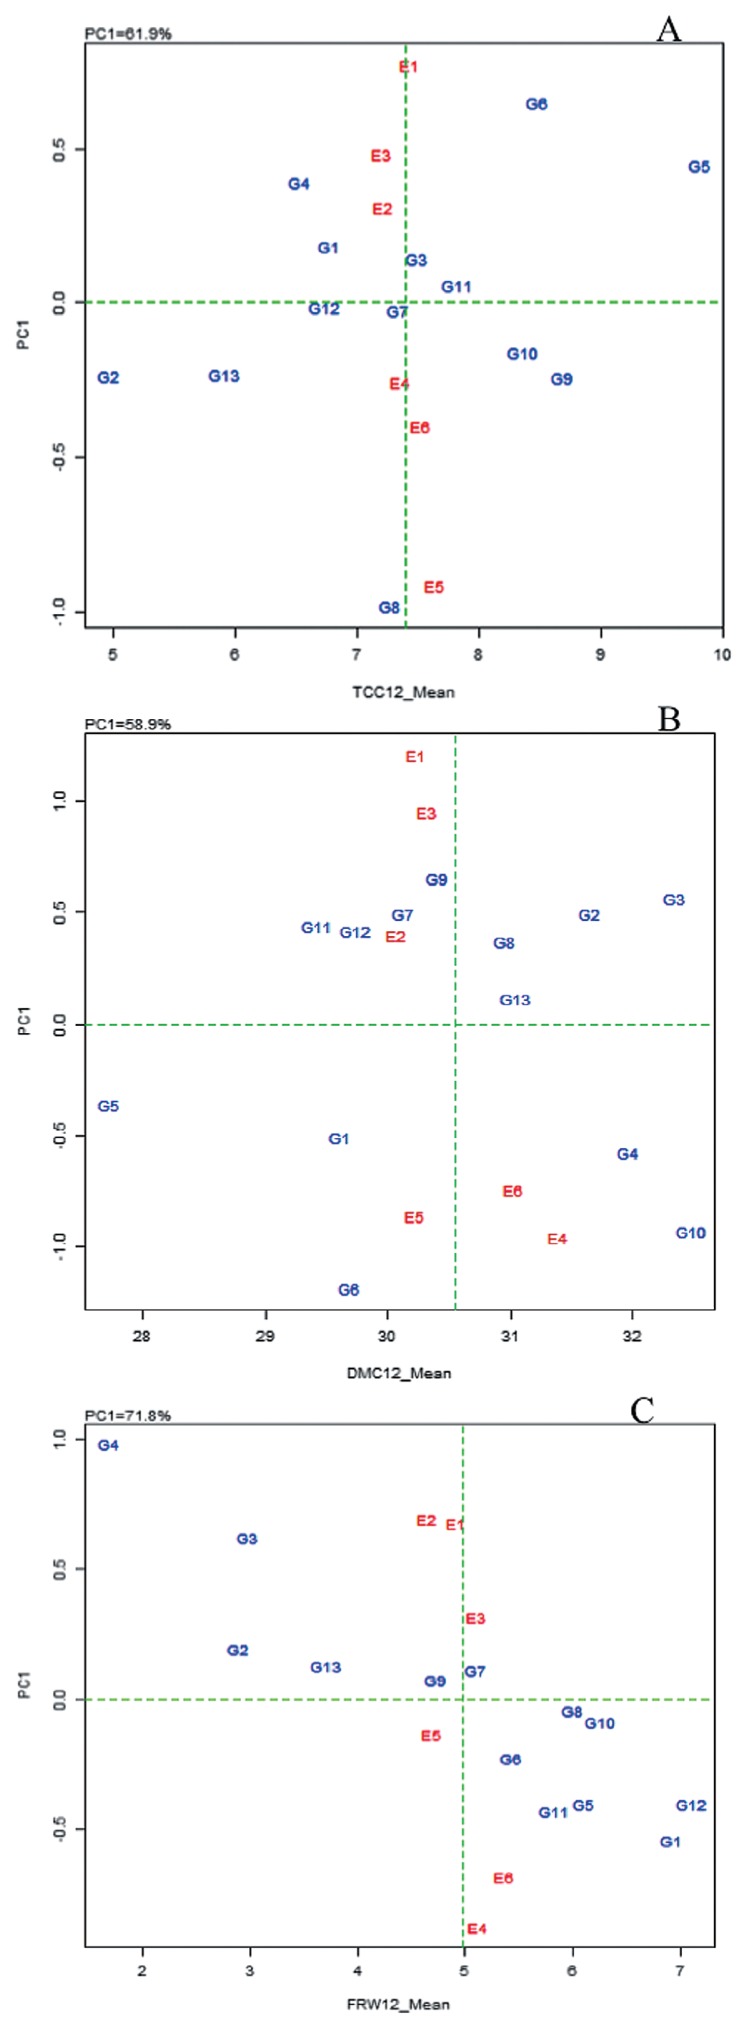
Fig. 1.
AMMI1 biplot for mean total carotenoid content (TCC), mean dry matter content (DMC) and mean fresh root weight (FRW) (A, B, C, respectively) against PC1 scores for 13 cassava genotypes evaluated in six environments in Uganda. TCC12_Mean = mean of TCC (μg g−1) at 12 MAP; DMC_Mean = mean of DMC (%) at 12 MAP; FRW_Mean = mean of FRW (ky plat−1) at 12 MAP; genotype (G1–G13) and environment (E1–E6) names are as defined in Tables 1, 2, respectively.

