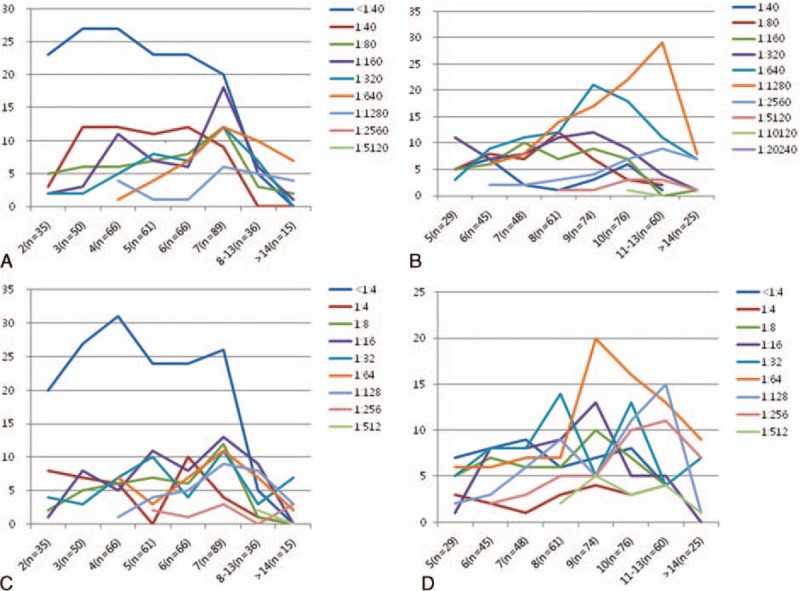
FIGURE 2.

Distribution of MP specific IgM antibody titers at presentation (A) and at 2nd examination (B), and CAs titers at presentation (C) and at 2nd examination (D) according to the duration of illness before admission ∗X-axes express the illness duration of patients at the examinations (patient numbers in respective durations of illness), and Y-axes express the numbers of patients who have respective titers of MP specific IgM (A and B) and respective CAs titers (C and D). CA = cold agglutinin, MP = Mycoplasma pneumoniae.
