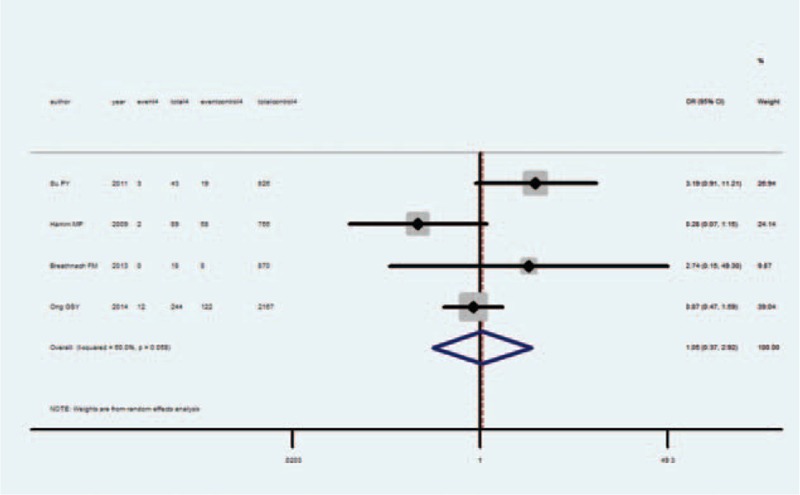
FIGURE 5.

Forest plots of studies comparing intrauterine growth restriction (IUGR) rates between isolated hypothyroxinemia and euthyroid pregnant women. Event 4: IUGR infant from isolated hypothyroxinemia women; total 4: isolated hypothyroxinemia women; event control 4: IUGR infant from euthyroid women; total 4: euthyroid women.
