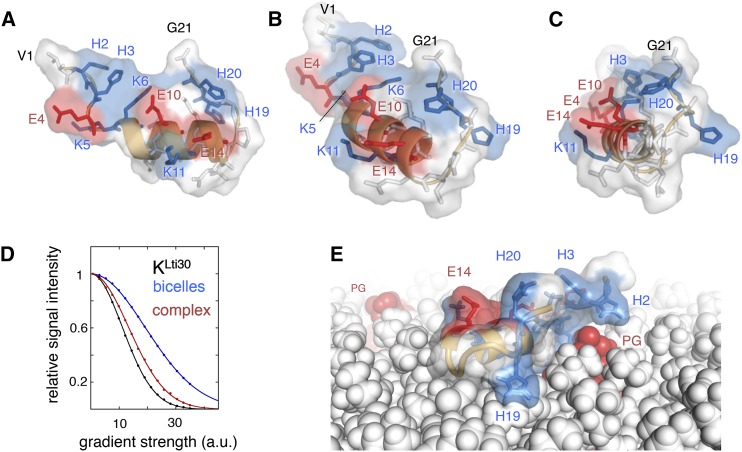
Figure 7.
Atomic resolution structure of the membrane-binding domain of Lti30. A to C, Atomic model of the membrane-binding KLti30 segment of Lti30, in side, diagonal, and front views, respectively. Positively charged residues are in blue, negatively charged residues are in red, and the hydrophobic side of the amphipathic α-helix faces downward. D, NMR diffusion data of KLti30 alone, bicelles alone, and KLti30 mixed with bicelles, verifying KLti30 micelle binding. a.u., Arbitrary units. E, Model of the positioning of the His-flanked KLti30 segment into a lipid bilayer (PC:PG 98:2 mix), using periodic boundary conditions. Consistent with the binding data in Figures 2 to 5, the positive side chains H2, H3, K5, and K6 coordinate the negative charge of a PG head group.

