Figure 2.
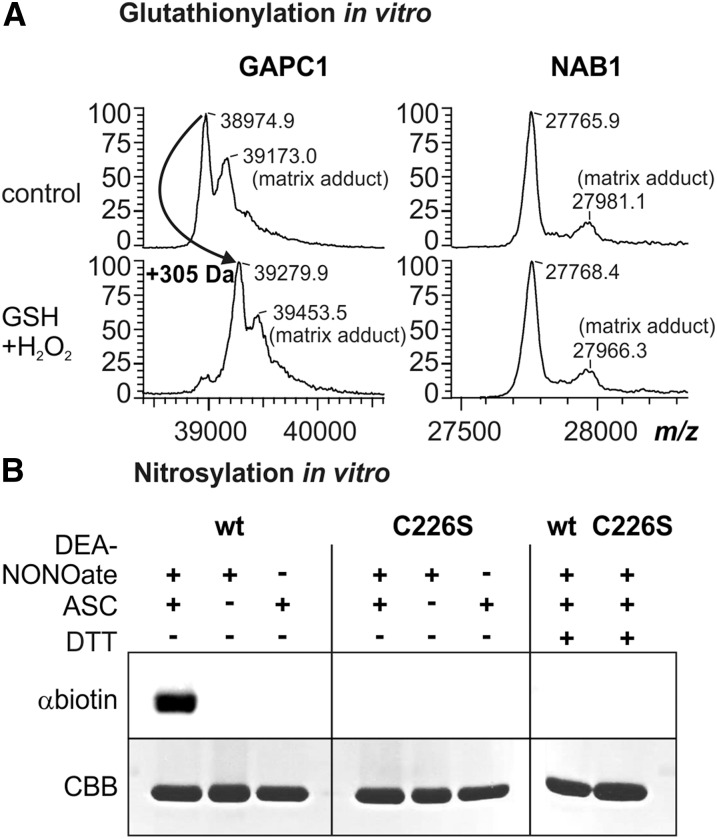
NAB1 can be nitrosylated in vitro. A, Analysis of NAB1 and GAPC1 in vitro glutathionylation following treatment with hydrogen peroxide (0.1 mm) and glutathione (0.5 mm) via MALDI-TOF mass spectrometry. Left panel: Mass spectrum of GAPC1 obtained after treatment with GSH+H2O2 and subsequent reduction using DTT (2.5 mm; used as a control). A mass increase of 305 D corresponds to one glutathione molecule covalently bound per protein monomer. The peaks labeled “matrix adducts” correspond to proteins with a sinapinic acid adduct. Differences between mass peaks of unmodified NAB1 and GAPC1 are within the experimental error of the instrument. Right panel: Mass spectrometric analysis of recombinant NAB1 under identical conditions. B, Treatment of recombinant NAB1 (wt) and NAB1C226S (C226S) with the NO-donor DEA-NONOate followed by the biotin switch technique. Addition (+) or omission (−) of the reaction components DEA-NONOate (1 mm), ascorbate (ASC; 40 mm), and DTT (20 mm) during the assay is indicated in the upper part. NAB1-biotinylation as an indicator for prior nitrosylation was detected by immunoblotting with a biotin-specific antiserum (αbiotin), and NAB1 protein amounts were assessed by Coomassie staining (CBB) after SDS-PAGE separation.

