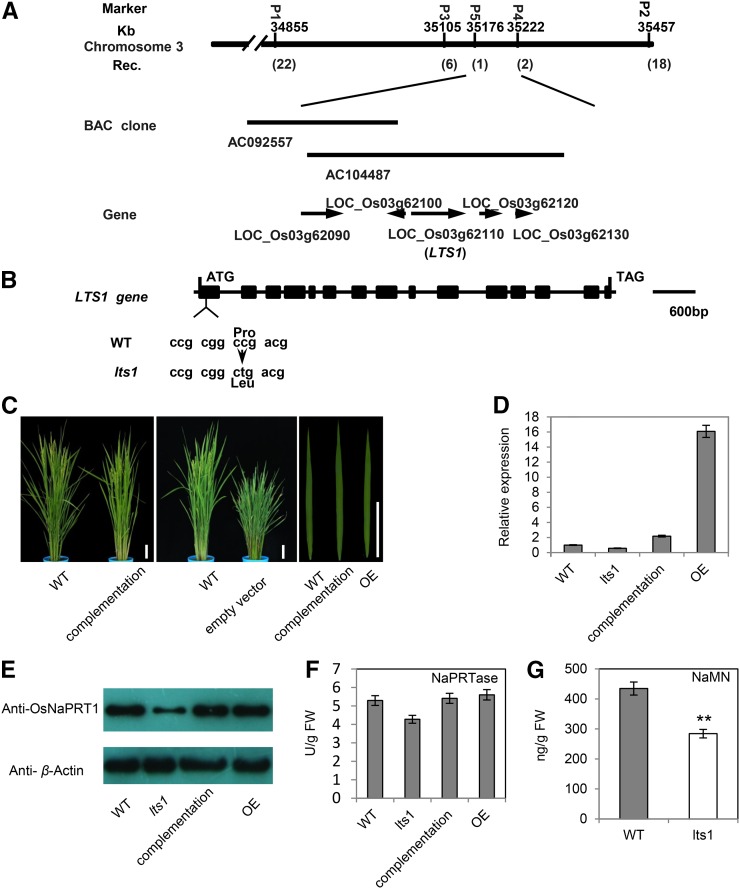
Figure 2.
Molecular characteristics of LTS1. A, Fine mapping of LTS1. Markers used for mapping are indicated. Numbers in parentheses indicate the number of recombinants. AC092557 and AC104487 are accession numbers of BACs. B, Schematic representation of LTS1. Black rectangles represent exons. C, Complementation of lts1 by genomic DNA of OsNaPRT1/LTS1. Bars = 10 cm. D, Quantitative RT-PCR analysis of OsNaPRT1/LTS1 expression levels in fully expanded leaves of wild-type, lts1, complementation, and overexpression lines at 80 d postgermination. Data are the mean values. Error bars refer to sd of three biological repeats. E, Western-blot analysis of OsNaPRT1 in fully expanded leaves of wild-type, lts1, complementation, and overexpression lines at 80 d postgermination. F, Enzyme activity of NaPRTase in wild-type, lts1, complementation, and overexpression lines determined in leaves of 50 d postgermination. Data are the mean values. Error bars refer to sd of three biological repeats. FW, fresh weight. G, Leaf contents of NaMN in 50-d-old wild-type and lts1 plants. Data are the mean values. Error bars refer to sd of three biological repeats. **P ≤ 0.01; Student’s t test.

