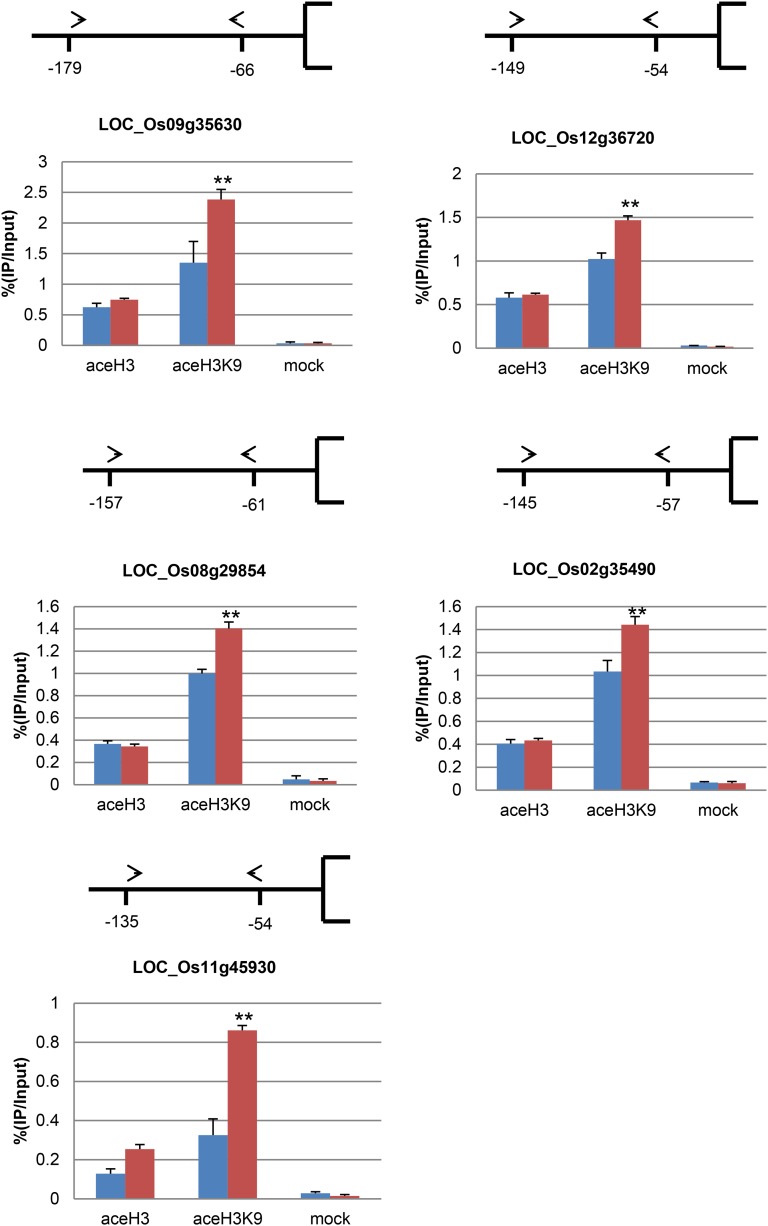
Figure 9.
Histone H3 and H3K9 acetylation of senescence-related genes in lts1. DNA was immunoprecipitated with antibodies specific to acetylated histone H3 (aceH3), acetylated H3K9 (aceH3K9), or without antibody (mock). Positions of primers relative to the initiation ATG codon are indicated by arrowheads and numbers. LOC numbers of selected genes are indicated below. Relative amounts of PCR products compared to input chromatin from wild-type extracts (arbitrarily set at 100) are shown in the graphs. Blue bars, the wild type; red bars, lts1. Data are the mean values. Error bars refer to sd of three biological repeats. **P ≤ 0.01; Student’s t test.

