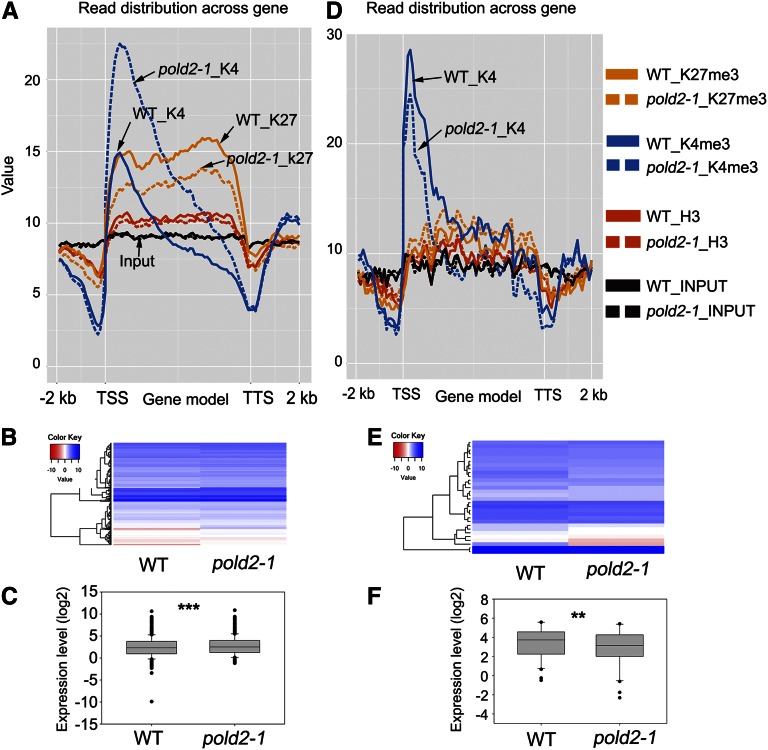
Figure 8.
Correlation between H3K4me3 signals across the gene and mRNA expression levels caused by pold2 mutant. A, Altered histone modification profiles of 499 H3K4me3-increased genes by pold2-1. Genes were aligned from the TSSs to the TTSs and divided into 60 bins. The 2,000-bp (2-kb) regions either upstream of TSS or downstream TTS were also included, and each was divided into 20 bins. Histone modification levels of each bin are plotted. B, Gene expression profiles of H3K4me3-increased genes by pold2-1. Values shown are log2FPKM. FPKM (fragments per kilobase of transcript per million mapped reads) was generated from RNA-seq using TopHat and Cufflinks software. C, Boxplot showing the expression (log2FPKM-transformed) of genes in B. The mean value of the pold2-1 group was significantly higher than that of the wild-type group (*** P < 0.0001, two-tailed, paired Student’s t test). D, Altered histone modification profiles of 32 H3K4me3-decreased genes by pold2-1 mutant. Genes were aligned from the TSSs to the TTSs and divided into 60 bins. The 2,000-bp (2-kb) regions either upstream of TSS or downstream TTS were also included, and each was divided into 20 bins. Histone modification levels of each bin are plotted. E, Gene expression profiles of H3K4me3-decreased genes by pold2-1 mutant. Values are log2FPKM-transformed. FPKM was generated from RNA-seq using TopHat and Cufflinks software. F, Boxplot showing the expression (log2FPKM) of genes in B. The mean value of the pold2-1 group was significantly lower than that of the wild-type group (** P < 0.001, two-tailed paired Student’s t test).

