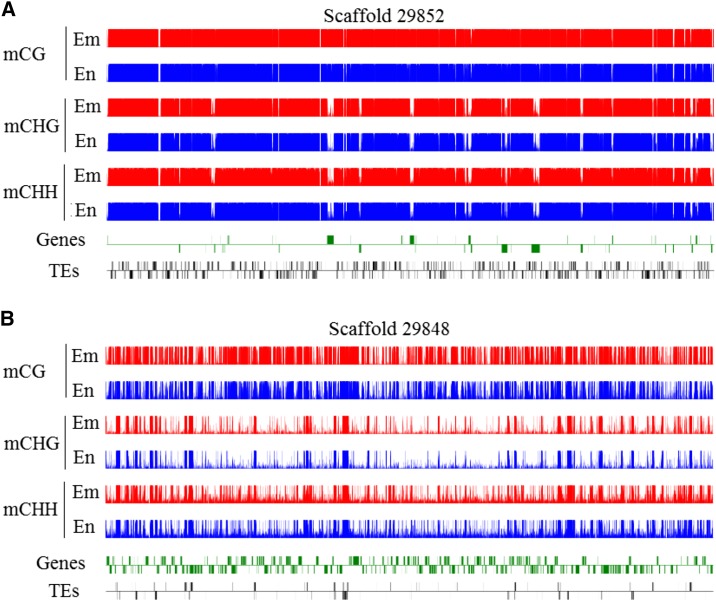
Figure 2.
DNA methylation profiles in castor bean seeds. A, Global distribution of the methylation of three sequences in scaffold 29852 (TE-rich scaffold). B, Global distribution of the methylation of three sequences in scaffold 29848 (gene-rich scaffold). Red and blue tracks represent the cytosine methylation in embryo (Em) and endosperm (En), respectively. Genes and TEs oriented 5′ to 3′ and 3′ to 5′ are shown above and below the lines, respectively.

