Figure 3.
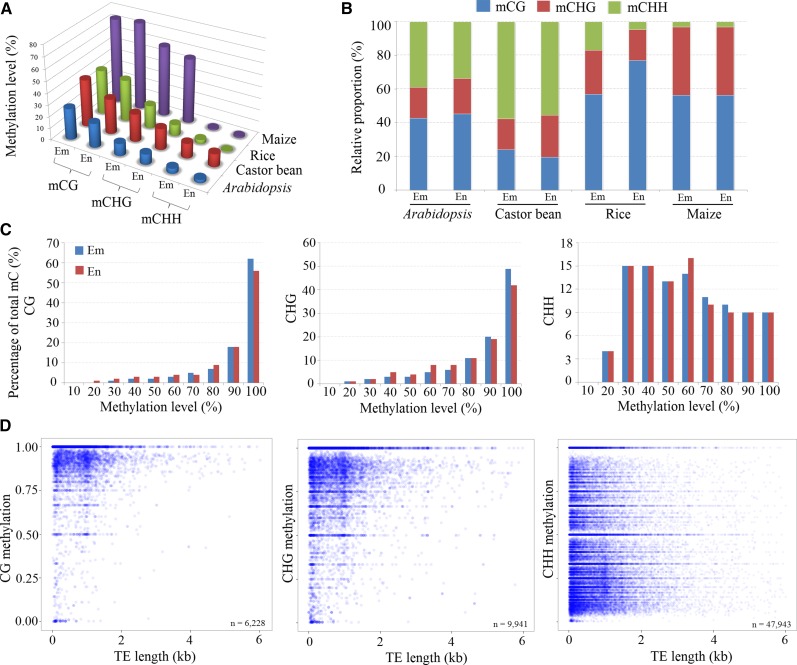
DNA methylation levels and distribution in castor bean seed. A, Genomic methylation levels of CG, CHG, and CHH in endosperm (En) and embryo (Em) among different species. B, Relative proportions of CG, CHG, and CHH methylation contexts in endosperm and embryo among different species. C, Histogram of methylation frequencies on the y axis for different levels (%) of CG, CHG, and CHH methylation (x axis) in endosperm and embryo tissues. D, Point scatter of the correlation between TE lengths and average methylation levels in CG, CHG, and CHH contexts.

