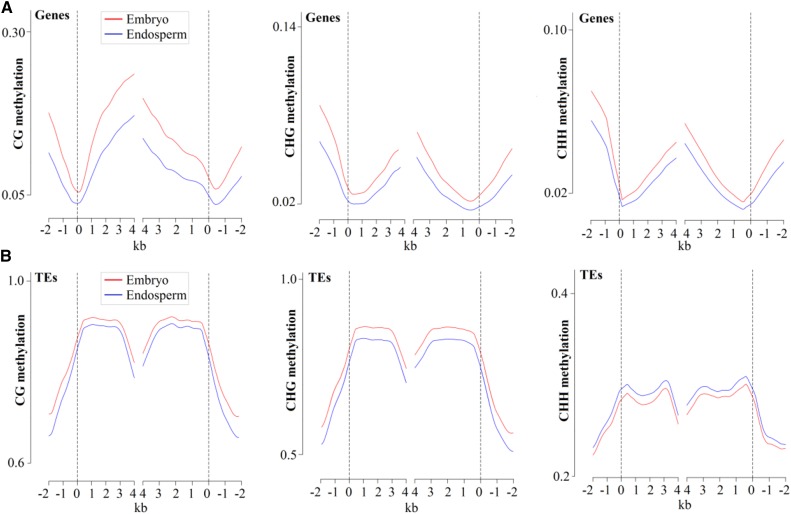
Figure 4.
Genomic DNA methylation profiles in endosperm (blue lines) and embryo (red lines) tissues. A, DNA methylation patterns across genes. B, DNA methylation patterns across TEs. Castor bean annotated genes and TEs were aligned at the 5′ end (left) or the 3′ end (right). The average methylation level for each 100-bp interval is plotted. The dashed lines represent the point of alignment.

