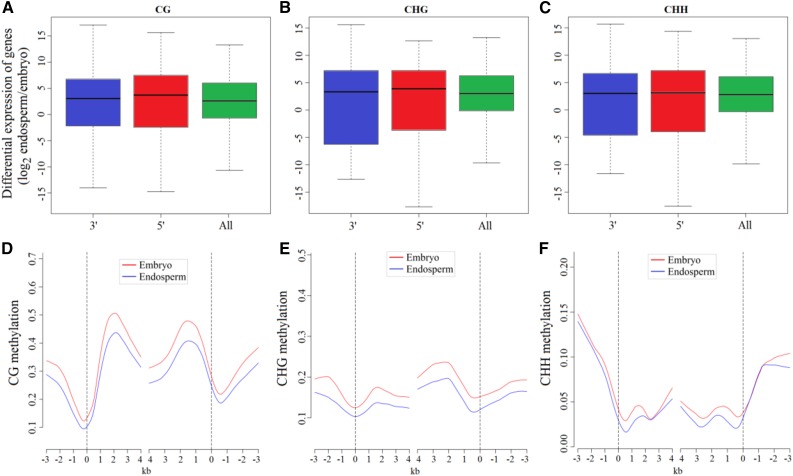
Figure 5.
Effect of hypo-DMR regions in endosperm on gene expression. A to C, Box plots indicate the differences of expression levels between endosperm and embryo for genes with either 5′ hypomethylation or 3′ hypomethylation in endosperm, compared with the average of all genes. D to F, Average methylation levels for endosperm-preferred genes with 4-fold expression levels relative to embryo are plotted for each 100-bp interval.

