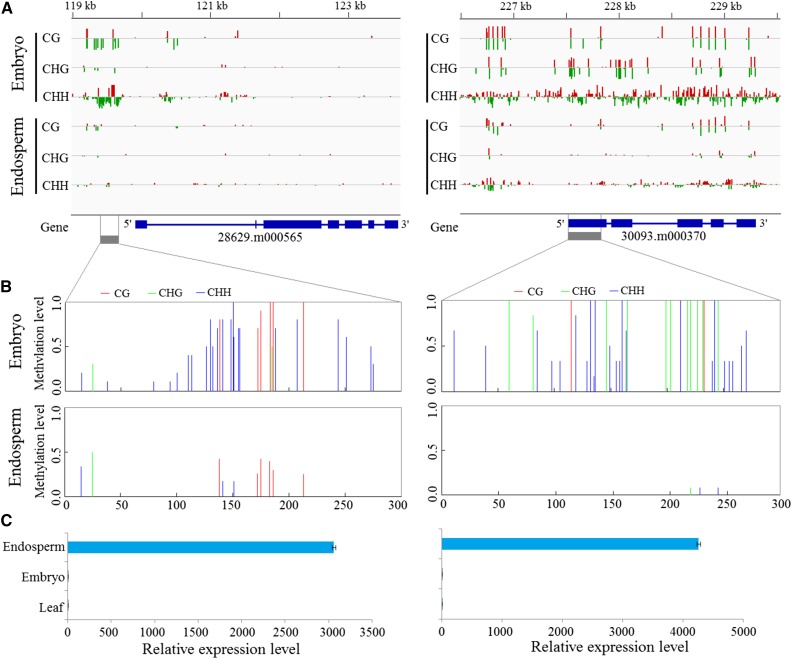
Figure 6.
Effects of two hypomethylation regions in endosperm on gene expression. A, DNA methylation levels of all three sequence contexts in endosperm and embryo. The gray boxes indicate the regions that were experimentally confirmed. B, Validation of DNA methylation levels by bisulfite PCR sequencing. C, Relative expression levels of two genes (28629.m000565 and 30093.m000370) overlapping the hypomethylation regions by quantitative PCR (qPCR) analysis.

