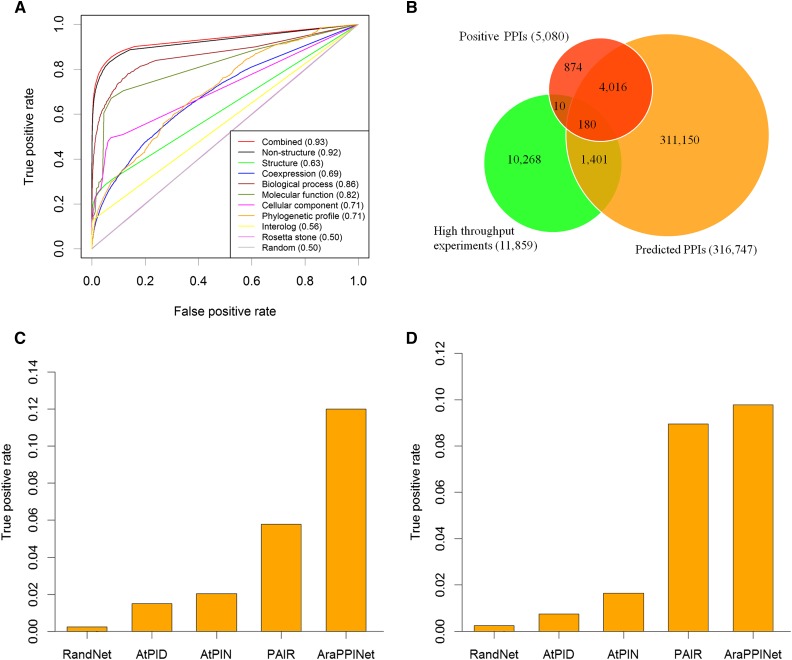
Figure 1.
Evaluation of AraPPINet performance. A, ROC curves for PPIs inferred from different data sources. AUC values are reported in parentheses. B, Venn diagram of predicted overlapping PPIs with experimentally determined interactions. C, Comparison of AraPPINet with other methods based on the high-throughput PPI data set. D, Comparison of AraPPINet with other methods based on newly reported interactions. The random PPI networks are generated by randomly rewiring edges while preserving the original degree distribution of AraPPINet. The average TPR is calculated from 10 randomized networks.

