Figure 1.
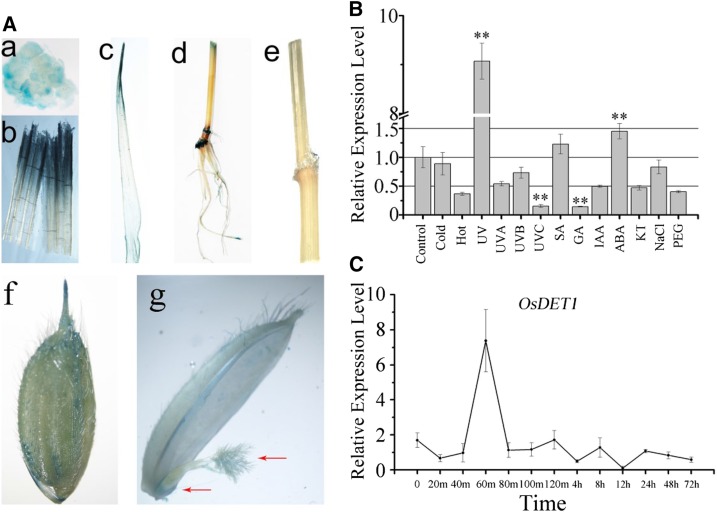
Analysis of OsDET1 expression. A, Histochemical staining of POsDET1::GUS transgenic plants. Transgenic plants were tested during protoplast culture and the flowering stage. Images are as follows: callus (a), leaf sheaths (b), leaves (c), roots, stems, and internodes (d), branches (e), panicle spikelets (f), and pistils and ovaries (g). B, Effects of phytohormones and abiotic stresses on OsDET1 expression. Two-week-old cv Nipponbare plants were used for the experiment. GA, Gibberellic acid; IAA, indole-3-acetic acid; KT, 6-furfurylaminopurine; PEG, polyethylene glycol; SA, salicylic acid. **, P ≤ 0.01 (Student’s t test). C, Kinetic analysis by qRT-PCR of OsDET1 expression after treatment with 50 μm ABA.

