Figure 10.
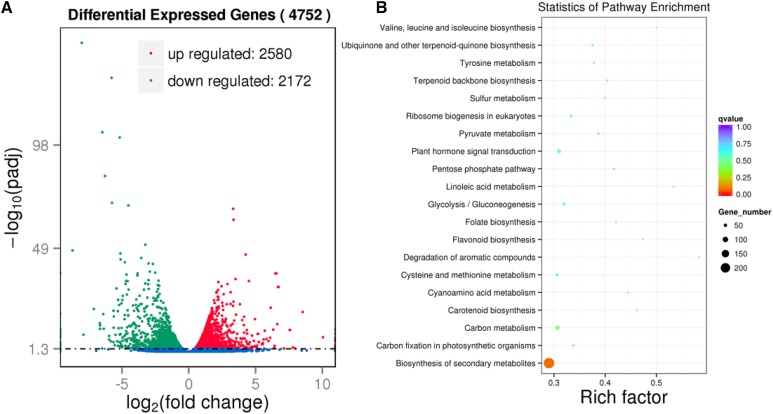
Transcriptome comparison between leaves of the wild type and DRI-16 using RNA-SEQ. A, Volcano plot showing DEGs of the wild type and DRI-16. Biological significance (log2 fold change) is depicted on the x axis and statistical significance (log10) is depicted on the y axis. Statistical significance was corrected at P < 0.05. B, Scatterplot of KEGG pathway enrichment statistics from wild-type and DRI-16 leaves. Rich factor is the ratio of the number of DEGs to the number of background genes in a KEGG pathway. The top 20 enriched KEGG pathways are listed.

