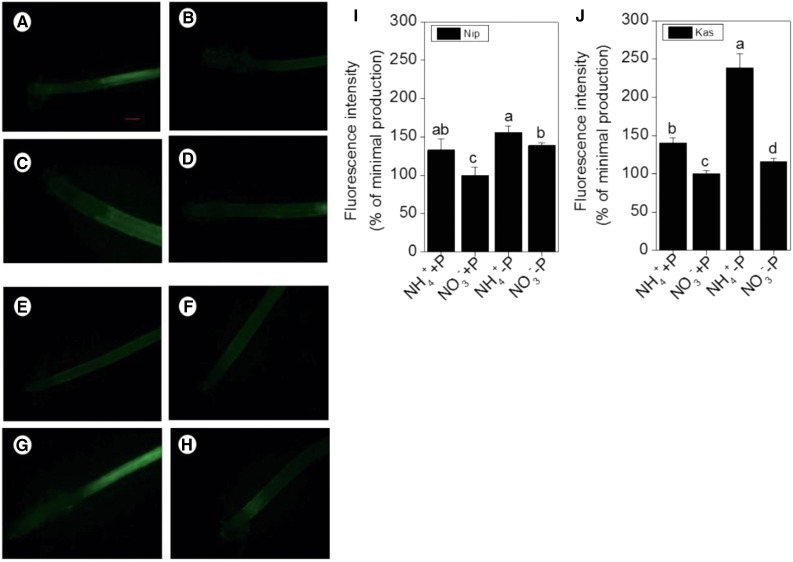
Figure 4.
Effect of nitrogen form (NH4+ or NO3−) on NO production, as indicated by green fluorescence. A, B, Representative roots of ‘Nip’ cultivar in the full nutrition solution. C, D, ‘Nip’ cultivar in P-deficiency solution. E, F, ‘Kas’ cultivar in the full nutrition solution. G, H, ‘Kas’ cultivar in the P-deficiency solution. (A, C, E, G) Culture in the NH4+ solution. (B, D, F, H) Culture in the NO3− solution. I, J, NO production expressed as relative fluorescence intensity (% of minimal production). Data are means ± sd (n = 10). Scale bar = 1 mm.

