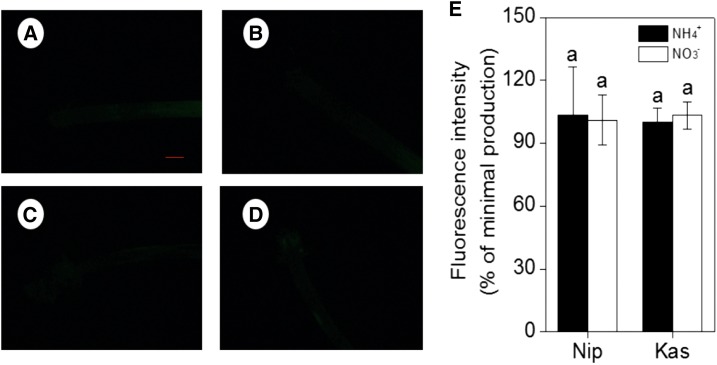
Figure 5.
Effect of NO scavenger c-PTIO on NO accumulation, as indicated by green fluorescence. Representative roots are shown. A, B, ‘Nip’ and C, D, ‘Kas’ cultivar in P-deficiency solution. (A, C) Culture in the NH4+ solution. (B, D) Culture in the NO3− nutrition solution. (E) NO production expressed as relative fluorescence intensity (% of minimal production). Data are means ± sd (n = 10). Scale bar = 1 mm.

