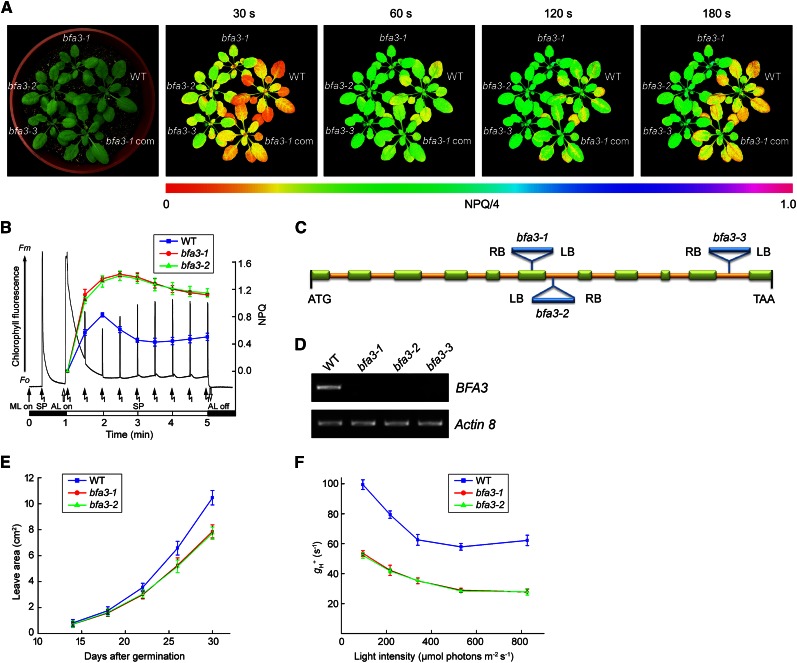
Figure 1.
Characterization of bfa3 mutants. A, Phenotype of 4-week-old bfa3 mutants. Images of NPQ were captured upon illumination for 30 s to 180 s (right). Signal intensities for NPQ/4 are indicated according to the color scale (from 0 to 1.0) at the bottom. WT, wild type; bfa3-1 com, bfa3-1 mutant complemented by introducing the genomic sequence of BFA3. B, Time course of NPQ induction. The black line represents a typical trace of chlorophyll fluorescence in WT. Induction of NPQ was monitored for 4 min at 80 μmol photons m−2 s−1 light intensity (colored lines). F0, minimal chlorophyll fluorescence; Fm, maximum chlorophyll fluorescence; ML, measuring light; SP, saturating light pulse. The black and white bars indicate darkness and actinic light (AL) illumination, respectively. Data are presented as the means ± sd (n = 3). C, Schematic representation of BFA3 in Arabidopsis. T-DNA insertion positions are indicated. Exons are shown as green rectangles and introns as yellow lines. D, RT-PCR analysis of BFA3 transcript accumulation in bfa3. Actin8 was used as a control. E, Growth rates of the bfa3 mutants compared with wild-type plants. Values are means ± sd (n = 3). (F) Light intensity dependence of H+ conductivity through ATP synthase (gH+).

