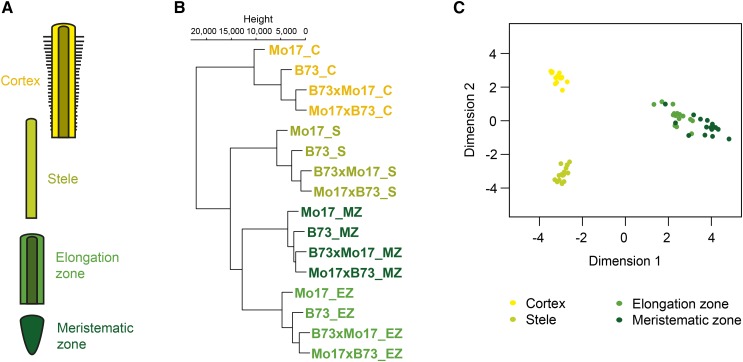
Figure 1.
Overview of RNA-seq sample relationship. A, Color-coded schematic of the four mechanically separated maize primary root tissues: yellow, cortex (C); light green, stele (S); green, elongation zone (EZ); dark green, meristematic zone (MZ). B, Hierarchical cluster analysis of normalized read counts among all four replicates of each RNA-seq sample. C, Multidimensional scaling plot of all 64 RNA-seq samples.

