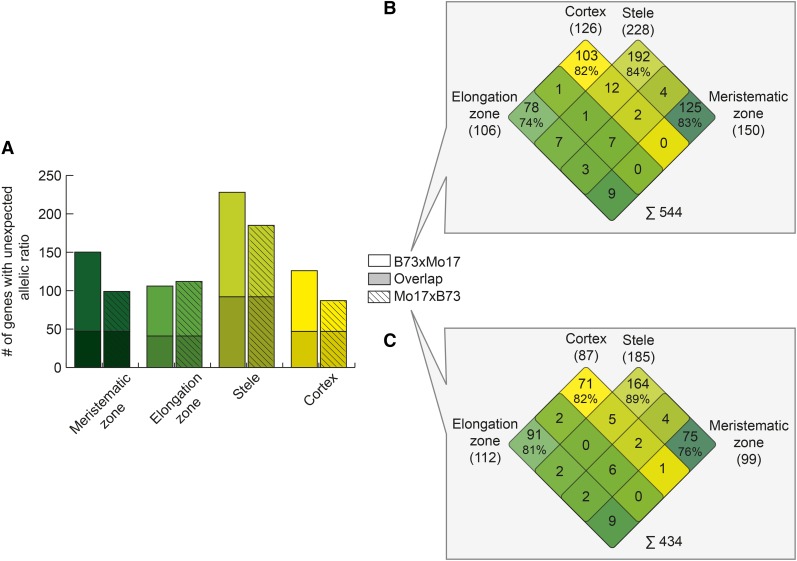
Figure 4.
Genes with unexpected allelic expression in the hybrids. A, Number of genes showing unexpected allelic ratios in both hybrids (plain: B73xMo17; shaded: Mo17xB73) for each primary root tissue. The overlapping genes between the two hybrids within each tissue are highlighted by the darker color. B and C, Overlap of genes with unexpected allelic ratio between the four different primary root tissues in B73xMo17 (B) and in Mo17xB73 (C). The numbers in parentheses indicate the total number of genes with unexpected allelic ratio in the corresponding root tissue.

