Figure 5.
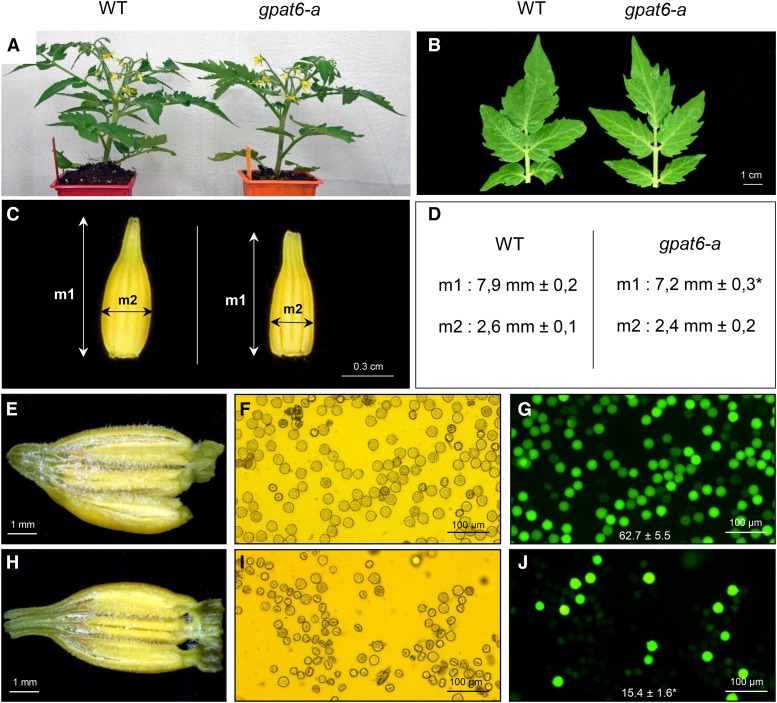
Morphological comparison of wild-type (WT) and gpat6-a plants, flowers, and pollen. A, Appearance of the plants 6 weeks after sowing. B, Morphology of the fourth leaf. C, Morphology of the detached anther cone. D, Measurements of the length (measure 1 [m1]) and thickness (m2) of the anther cone. Mean values (in mm) of 20 measures are given with sd. The asterisk indicates a significant difference from wild-type fruit (Student’s t test, P < 0.01). E and H, Macroscopic observations of dissected anthers of wild-type (E) and gpat6-a (H) flowers. F, G, I, and J, Microscopic observations under visible light (F and I) and at λ = 495 nm (G and J) of wild-type (F and G) and gpat6-a (I and J) pollen stained with 2% fluorescein diacetate. The pollen viability is determined by the numeration of fluorescent spots compared with the total number of pollen grains in the acquisition field. Mean values of 10 fields are given in percentage with sd. The asterisk indicates a significant difference from the wild-type fruit (Student’s t test, P < 0.01).

