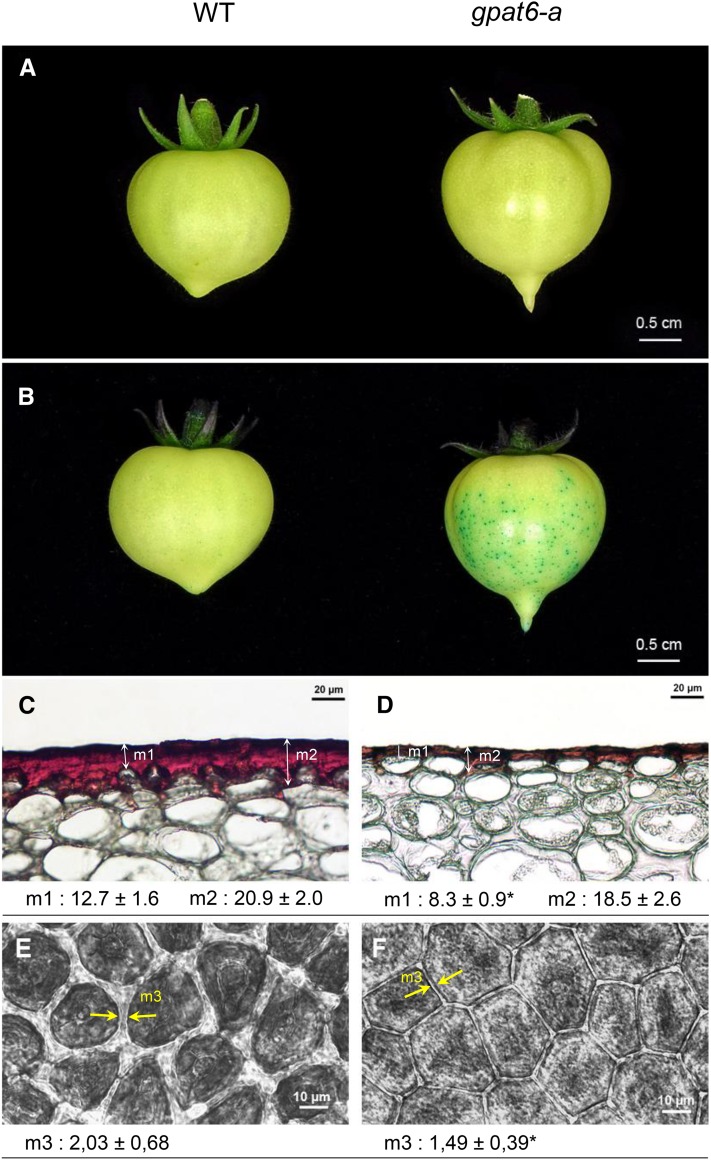
Figure 6.
Cuticle phenotypes of wild-type (WT) and gpat6-a fruits. A, Macroscopic observation of the brightness of mature green stage fruits. B, Macroscopic observation of cuticle permeability to 0.5% Toluidine Blue. C and D, Microscopic observations of 8-µm cryosections of cuticles from wild-type (C) and gpat6-a (D) breaker stage fruits after Oil Red O staining. Mean values (µm) of 40 measurements from three different sections are given with sd, in two different positions, on the top of the epidermal cell (measure 1 [m1]) and between epidermal cells (m2). The asterisk indicates a significant difference from the wild-type fruit (Student’s t test, P < 0.01). E and F, Microscopic observations of freshly peeled outer epidermal tissue from wild-type (E) and gpat6-a (F) red ripe stage fruits. The width of the cutinized cell wall was measured between the two yellow arrowheads (m3). Mean values (µm) of 620 measures (20 measurements of 31 sections) are given with sd. The asterisk indicates a significant difference from the wild-type fruit (Student’s t test, P < 0.01).

