Figure 2.
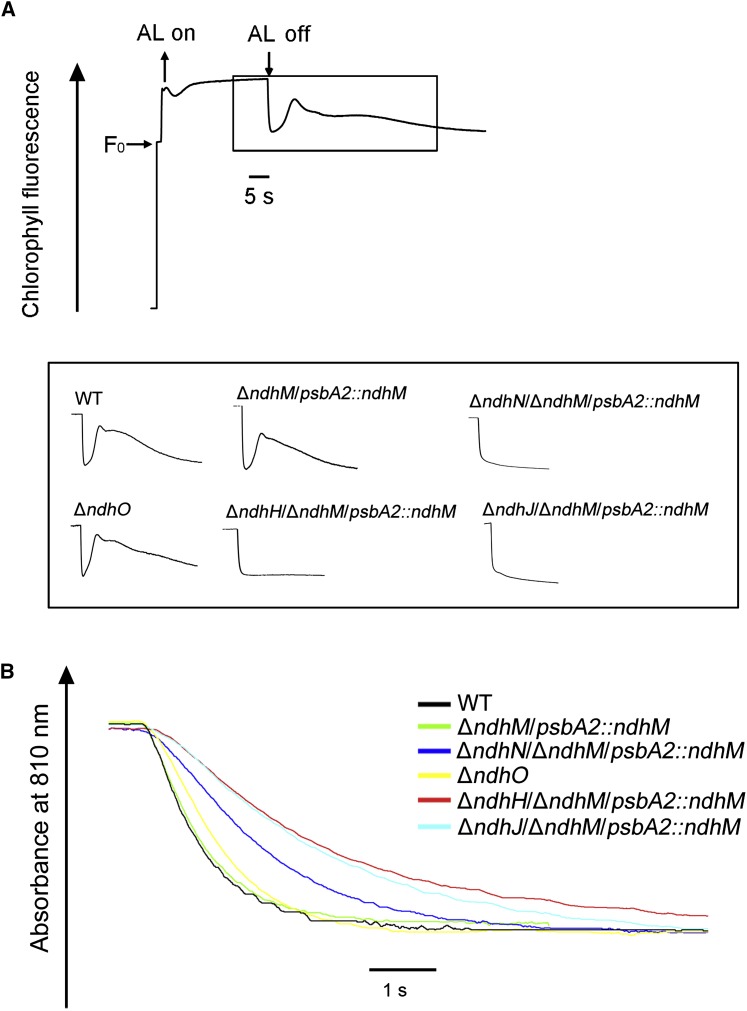
The effects on NDH-1 activity of the different NDH-1 mutants. A, Monitoring of the NDH-1 activity using chlorophyll fluorescence analysis. The upper curve shows a typical trace chlorophyll fluorescence in Synechocystis 6803. Cells were exposed to the AL (60 μmol photons m−2 s−1) for 60 s. After it was switched off, the transient increase in chlorophyll fluorescence level was ascribed to NDH-1 activity. The inset shows the magnified traces from the box area. B, Kinetics of P700+ rereduction in darkness after turning off far-red light in the presence of 10 μm DCMU. The chlorophyll a concentration was adjusted to 30 μg mL−1, and curves are normalized to the maximal signal.

