Figure 3.
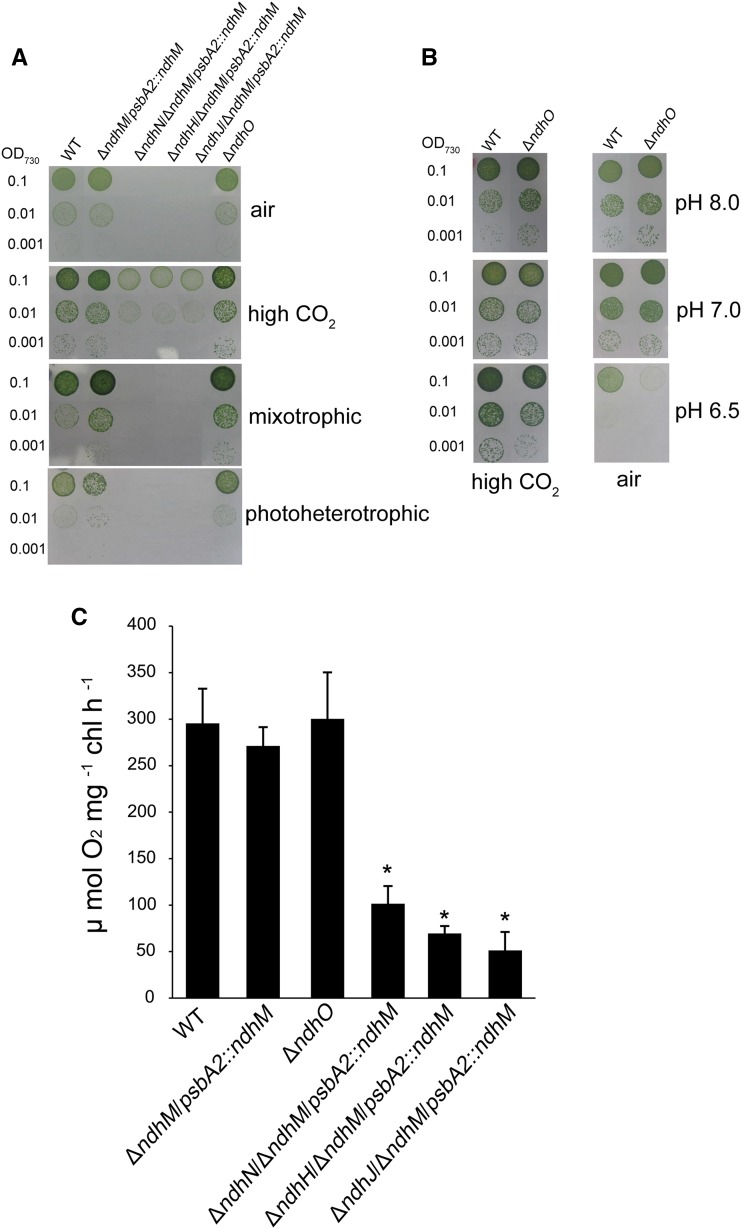
Growth and the oxygen evolution rates of the wild type and different NDH-1 mutant strains. A and B, Growth of wild-type, ndhN, ndhH, ndhJ, and ndhO deletion mutants. The concentration of the cells was adjusted to OD730 = 0.1, 0.01, and 0.001. Three microliters of the cell suspensions was placed on the agar plate with different carbon sources, and 3 μL of wild-type and ΔndhO strains was spotted on the agar plates buffered at pH 8.0, 7.0, and 6.5. The cultures were grown for 7 d at 40 μmol photons m−2 s−1. High CO2, 2% CO2 (v/v) in air; mixotrophic, BG-11 medium + 5 mm Glc; photoheterotrophic, BG-11 medium + 5 mm Glc + 10 μm DCMU. C, The rates of O2 evolution of wild-type, ndhN, ndhH, ndhJ, and ndhO-deletion mutants using a light intensity of 400 μmol photons m−2 s−1 at 30°C. Values are means ± se of three replicates. Asterisks indicate a significant difference from the wild type under the same growth conditions (Student’s t test, P < 0.05).

