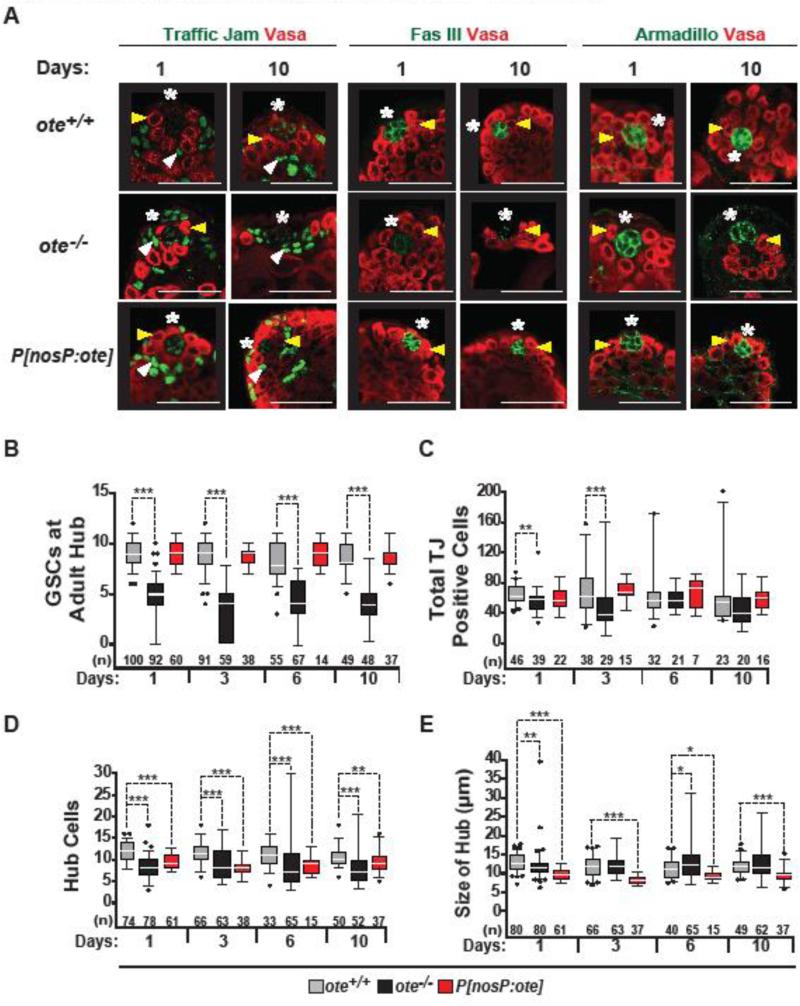
Figure 5. Age-dependent changes in the adult ote−/− testis niche.
A. Confocal images of one- and ten-day-old ote+/+, ote −/−, and ote−/−, P[nosP:ote, w+] testes stained with Vasa (red) and one of the following in green: TJ, Fascilin (Fas) III or Armadillo. Yellow arrowheads mark positions of GSCs; white arrowheads mark positions of CySCs; asterisks mark positions of the hubs. Scale bars, 20 μm. B-E. Quantification of the number of GSCs (B), the total number of TJ-positive cells (C), the total number of hub cells (D) and hub size (E) in aged testes obtained from ote+/+ (gray), ote−/− (black), and ote−/−, P[nosP:ote, w+] (red) males. The number of testes analyzed is shown below each bar. The limits of box plots and analyses are as described in Fig. 1.

