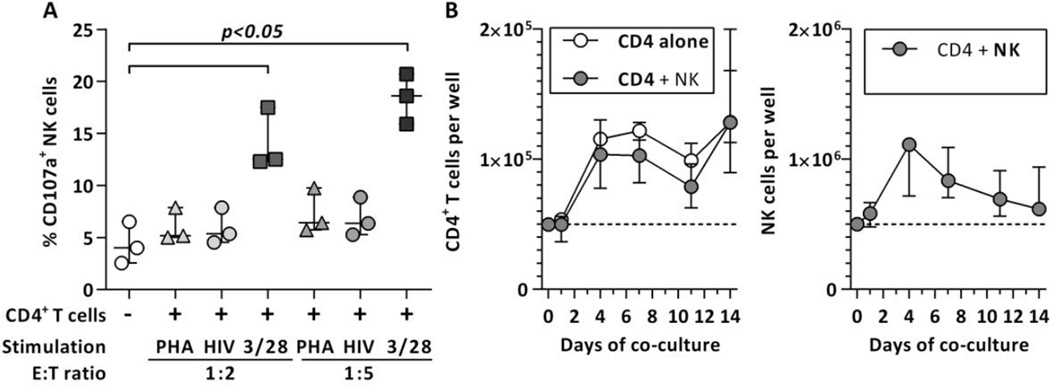
Figure 4. NK cell activation and effector/target cells numbers during NK/CD4+ T cell co-culture.
Figure 4A displays the levels of NK cell degranulation (CD107a expression) following co-incubation with differentially stimulated CD4+ T cells at two effector:target cell ratios. CD4+ T cells were either stimulated with CD3/28 beads (squares) or PHA with (circles) or without (triangles) subsequent in vitro HIV-1 infection for 3 days and then co-incubated with enriched NK cells for 4 hours. Figure 4B shows the kinetics of NK cells and CD4+ T cells numbers during the co-culture. CD4+ T cell numbers following infection with HIV-1 (MOI: 0.01) in the presence (grey circles) or absence of NK cells (clear circles) are shown in the left panel of 4B, NK cell numbers on the right panel. The initial effector:target cell ratio was 10:1. Cell numbers were normalized to 5*104 and 5*105 per well respectively for better comparison. Median and IQR of 3 independent experiments (subjects) are displayed for both experiments. Statistical analysis was conducted using Friedman test and Dunn’s multiple comparison test.

