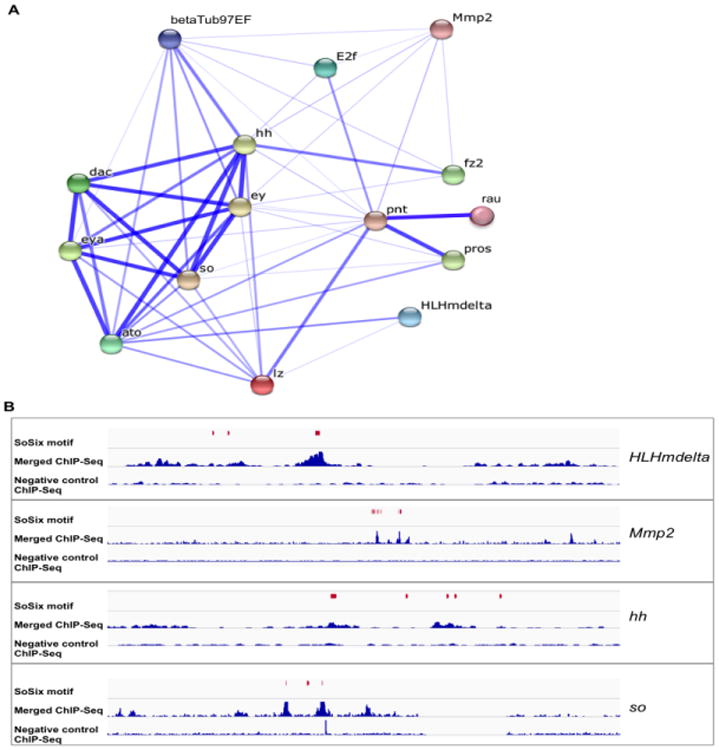
Figure 4.

Predicted interaction network and validation using ChIP-Seq data. (A) The associations shown were generated based on STRING analysis; stronger associations are represented by thicker lines. This network includes previously known So targets and predicted targets (confident hits) identified in this study. (B) Examples showing the overlap between SoSix1 motif predictions and ChIP-Seq peaks for the predicted target genes HLHmdelta, Mmp2, hh and so. Each panel includes ChIP-Seq data (2 replicates merged, middle line and negative control, bottom line) and the positions of each SoSix1 motif (in red).
