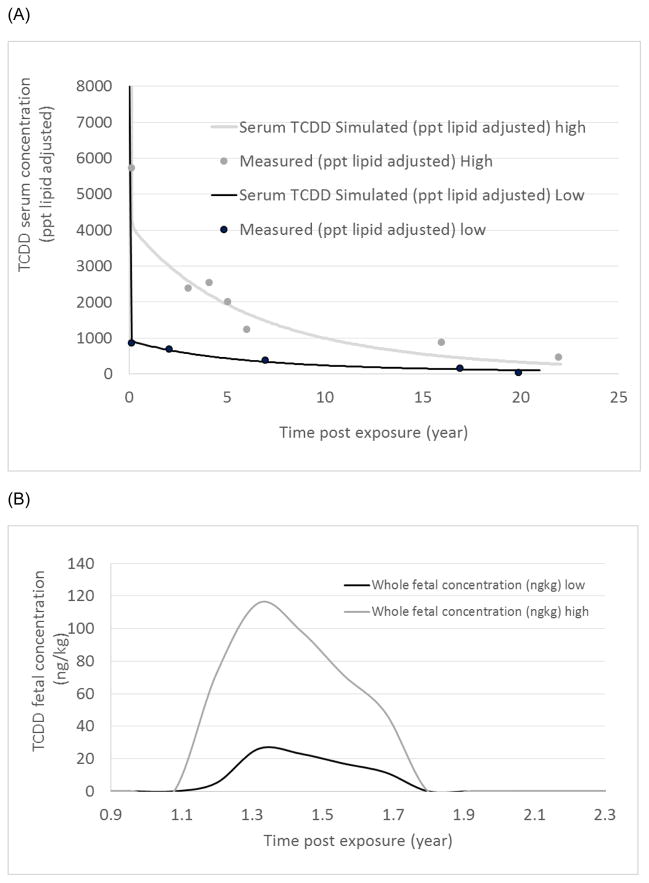
Fig. 2.
Simulated tissue concentration time course for a woman with a single gestation who was exposed in Seveso, Italy, in 1976. The figures express (A) a TCDD serum concentration in lipid adjusted and (B) fetal concentrations at the higher exposure dose (2,000 ng of TCDD/kg of body weight) or at low exposure dose (250 ng of TCDD/kg of body weight), following a single exposure oral dose.

