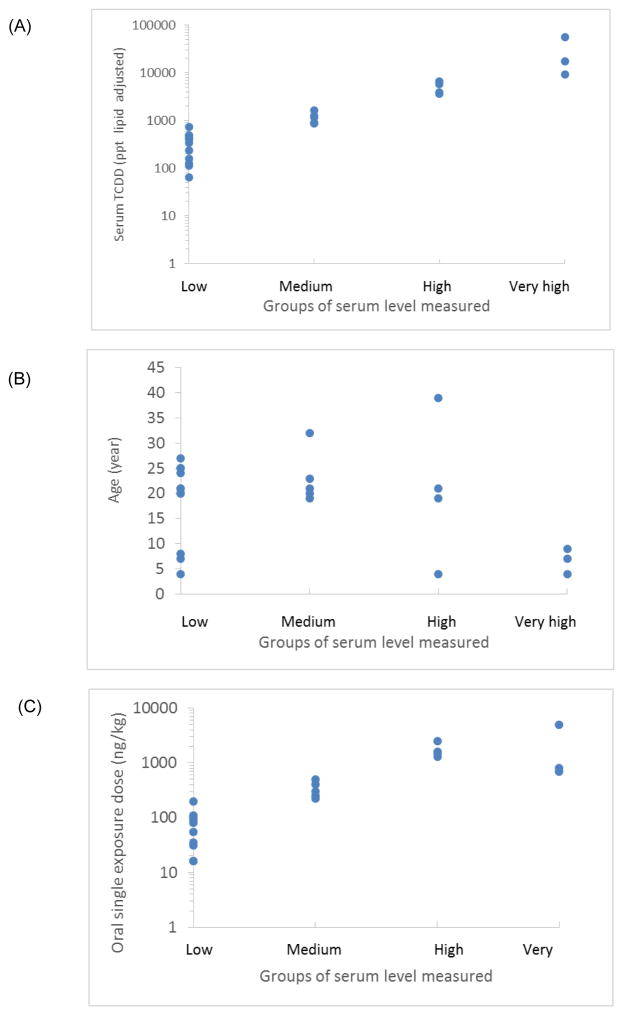
Fig. 3.
A comparison of (A) age (years), (B) serum TCDD concentration (ng/kg lipid adjusted in log scale to a subgroups of exposure, and (C) exposure dose estimated with the PBPK human model for TCDD. The parameters are compared to the subgroups of serum-level categories corresponding to low (≤200 ng/kg), medium (>200 to ≤1,000 ng/kg), high (>1,000 to <5,000 ng/kg), and very high (≤5,000 ng/kg) measured exposures.

