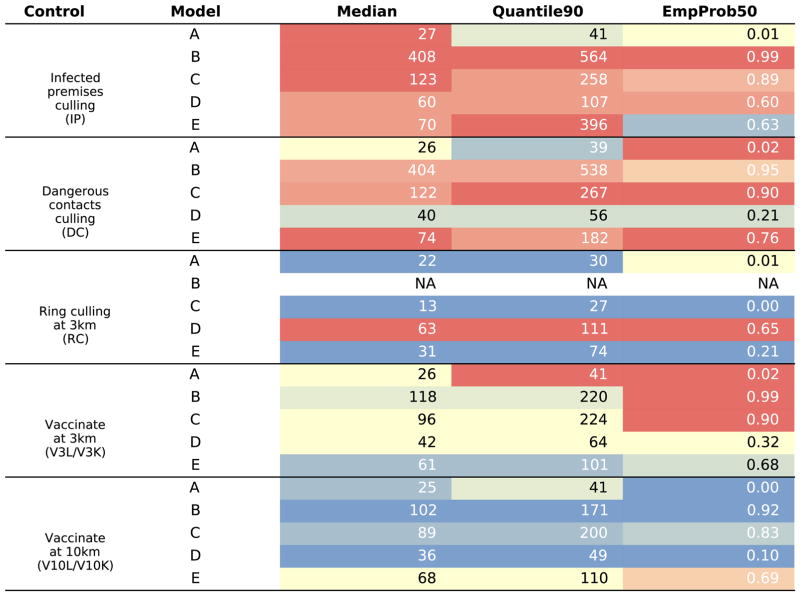
Figure 2.
Outbreak duration (days) of control actions (grouped rows) evaluated against several objectives (columns) under five models (rows). Column titles represent the statistic used for ranking the control actions. Cells are rounded to integer values, and are coloured according to rank with red representing worst performing control actions and blue representing best performing control action (within both a model and objective). The final column is the empirical probability of the outbreak duration being longer than 50 days.

