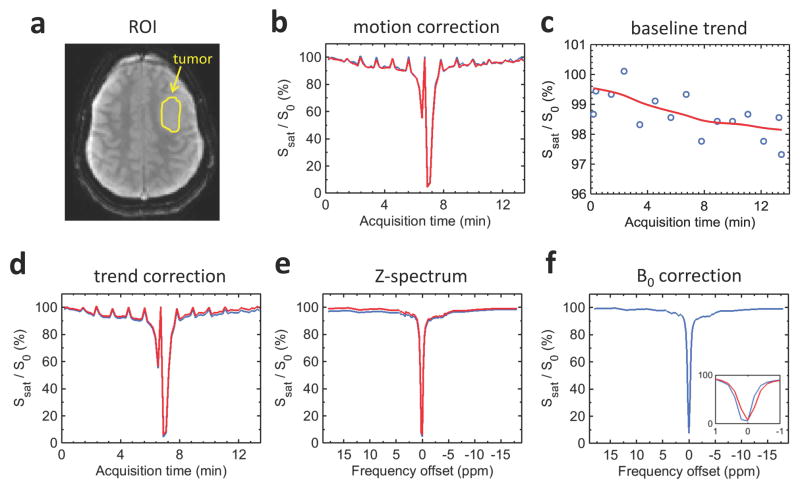
Figure 2.
Pulsed steady-state CEST image preprocessing procedure. (a) Axial unsaturated image and tumor ROI (yellow outline) for a low-grade (grade II) oligodendroglioma patient. (b) Illustration of the variation of CEST signal intensity before (blue line) and after (red line) motion correction. (c) Signal drift estimate (red line) based on multiple unsaturated data (blue circles). (d) Illustration of the variation of CEST signal intensity before (blue line) and after (red line) detrending. (e) Illustration of Z-spectrum before (blue line) and after (red line) motion and trend correction. (f) Illustration of Z-spectrum before (blue line) and after (red line) B0 correction using Lorentzian fitting. The inset shows the CEST signal intensity before (blue line) and after (red line) B0 correction in the frequency offset range of −1 to 1 ppm.

