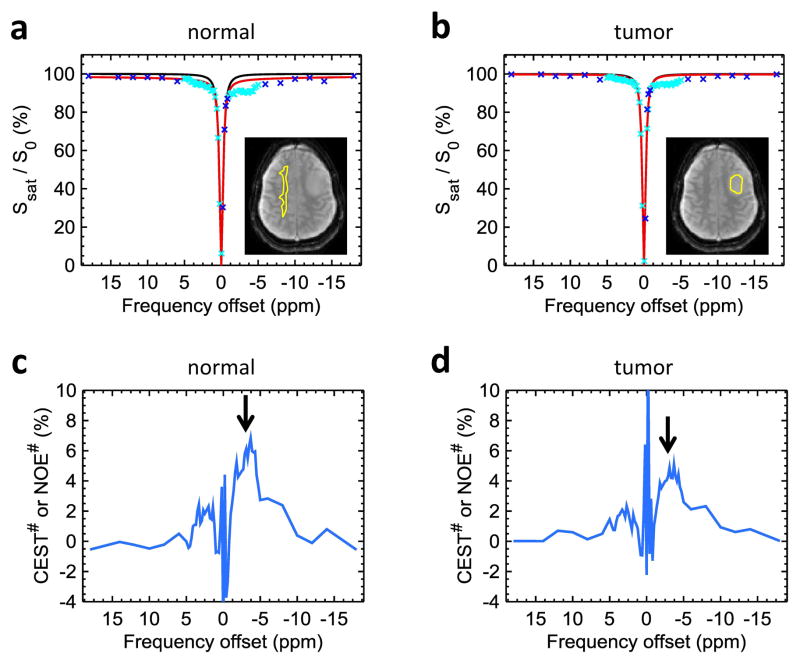
Figure 3.
Quantification of downfield CEST# and upfield NOE# signals using EMR approach. Two-pool MTC (red line) and DS models (black line) were fitted with experimental data (blue crosses) obtained from the normal-appearing white matter tissue (a) and the tumor region (b) for a low-grade (grade II) oligodendroglioma patient. Quantitative CEST# and NOE# signals were obtained by subtracting the experimental measured Z-spectra (sky-blue crosses as shown in Fig 3a and 3b) from the ZEMR data (red lines as shown in Fig 3a and 3b) in the normal tissue (c) and the tumor region (d).

