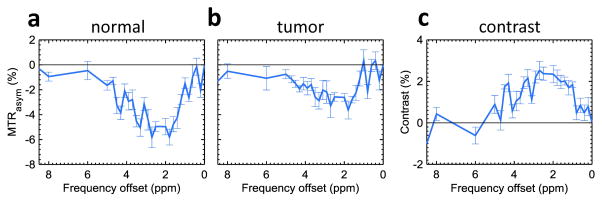
Figure 4.
MTRasym spectra of the normal tissue (a) and tumor (b) ROIs as shown in Fig. 3a and 3b and MTRasym image contrast between the tumor and normal tissue (= MTRasym(3.5ppm)tumor–MTRasym(3.5ppm)normal) (c). The MTRasym values were negative at most frequency offsets due to larger upfield NOE effects at the low RF saturation power. Error bars depict standard errors.

