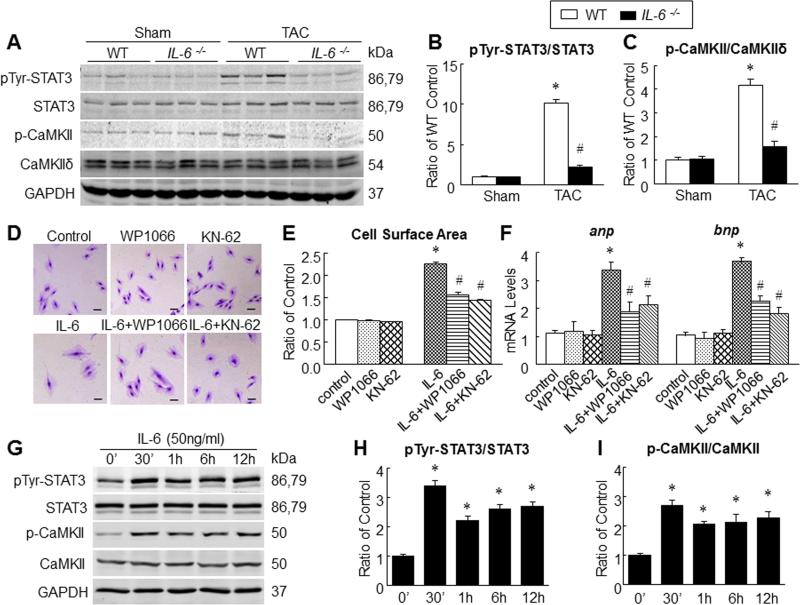
Figure 7. STAT3 and CaMKII contributed to IL-6-Induced cardiac myocyte hypertrophy.
A-C, representative Western immunoblots (A) and quantitative data for pTyr-STAT3 (B) and p-CaMKII (C) in WT and IL-6−/− mouse hearts at 6 weeks after surgery (n=6 per group), *P<0.05 vs. Sham WT mice; #P<0.05 vs. TAC WT mice. D, representative images of H9c2 cells stained with 1% crystal violet after treatment with KN-62 (10μmol/L) or WP1066 (6μmol/L) in the presence and absence of rIL-6 (50ng/ml) for 24 h, scale bar=100 μm. E, cell surface area measured after 24 h of exposure to rIL-6 in the presence or absence of inhibitors of CaMKII or STAT3. F, Levels of mRNA for anp and bnp as determined by qPCR after 24 h of exposure to rIL-6 in the presence or absence of inhibitors of CaMKII and STAT3. (GI) stimulation with rIL-6 (50ng/ml) for variable duration with subsequent quantitation of pTyr-STAT3 (H) and p-CaMKII (I). Data represent means ± SEM from three independent experiments. *P<0.05 vs. control; # P<0.05 vs. rIL-6 treatment only.

