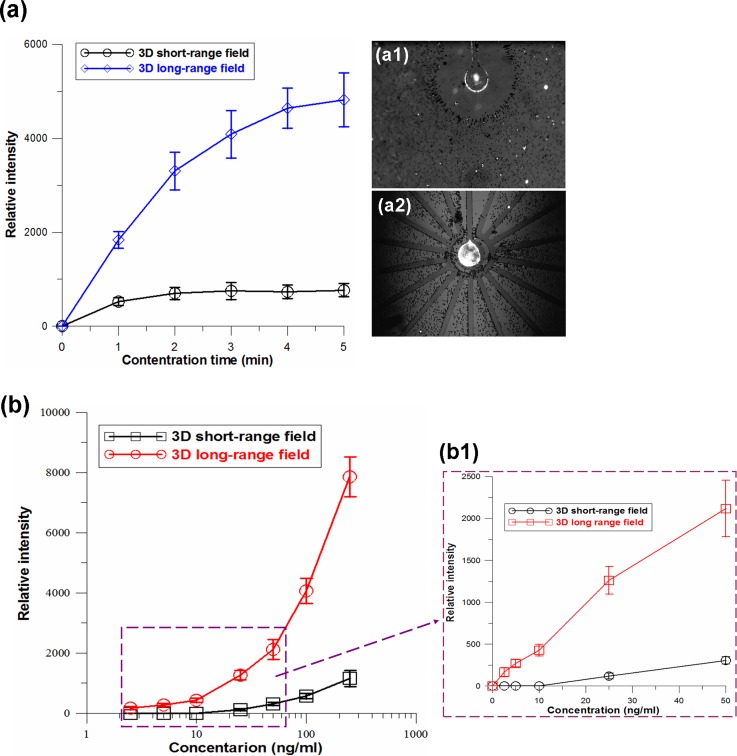
FIG. 4.
(a) Intensity accumulation profiles obtained by continuous pre-concentration of nanocolloids from diluted blood using 3D DEC (a-1) and TEC (a-2) chips, respectively. (b) Fluorescence intensity versus different nanocolloid concentrations. The florescence intensity was measured after electrokinetic concentration of nanocolloids from the diluted blood for 5 min using the 3D short-range DEC and long-range TEC chips, respectively. (b-1) The linear scale data in a range between 2.5 and 50 ng/ml. The detection limit of the 3D short-range DEC and long-range TEC electrokinetic concentrations reached 25 ng/ml and 2.5 ng/ml, respectively.

