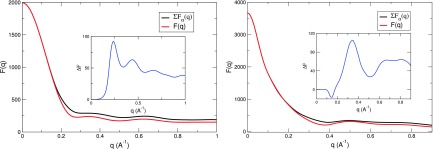
FIG. 3.
Comparison between the “real” excess amplitude (red) with the sum of component amplitudes (black) for lysozyme (left) and DNA (right) using calculated profiles from 3D-RISM. For Lys, k is solu and hyd; while for DNA there are also counter-ion (Na+) and co-ion (Cl−). The difference between these two is plotted in the inset (blue).

