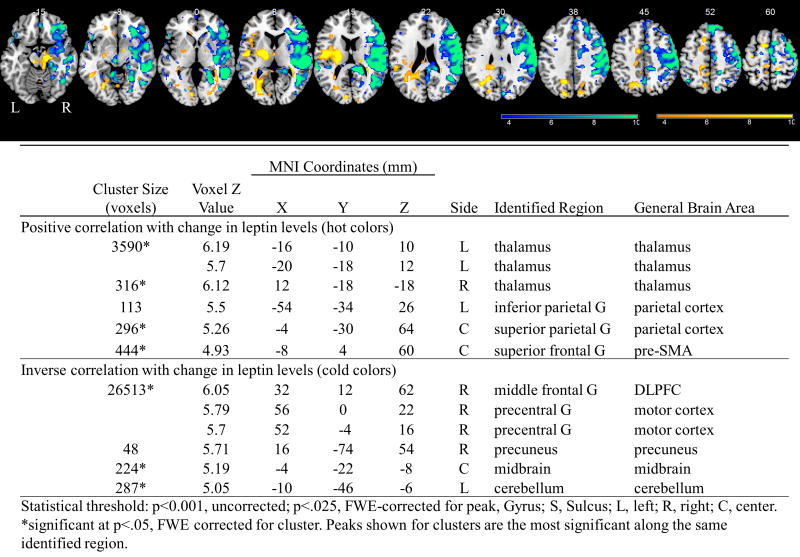
Figure 2.
Results of whole brain regressions while participants were on liraglutide with the change in leptin levels from baseline to 17 days during the fasting state while viewing highly desirable as compared to less desirable food cues at p<.001. BOLD contrasts are superimposed on a T1 structural image in neurological orientation. The color bar represents voxel T value. Table shown below figure for activations significant at P<.025, FWE-corrected for peak.

